![]()
Frontline Learning Research Vol.13 No. 3 (2025)
108 - 122
ISSN 2295-3159
1University of Antwerp, Antwerp,
Belgium
2University of Ioannina, Ioannina, Greece
3University of Turin, Turin, Italy
4Universitas Mercatorum, Italy
5Panteion University, Athens, Greece
Article received 13 September 2021 / revised 13 November 2025 / accepted 27 November 2025 / available online 2 April 2026
Investigations into the prevalence of careless responding (CR) in online student learning survey research are scarce, and little to no information is present about the impact on data quality. This study illustrates how an unobtrusive post hoc method of CR detection can be applied using four indices, which can be calculated in most student learning surveys. By applying latent profile analyses in an exemplary sample of 1,111 first-year university students, different responder profiles are identified, showing the presence of careful and careless responder profiles. The study further examines the impact of CR on data quality, raising concerns about reliability and validity. The study calls for more attention to the presence of CR when analysing data in online student learning survey research. CR detection is also valuable for practice, specifically when online survey-based feedback is provided to learners with more questionable responding behaviour.
Keywords: careless responding; student learning; survey; reliability; validity
In higher education, different low and high-stakes assessment forms are used to inform, guide, or assess the quality of student learning. On the one hand, separate student learning surveys (such as ILS, SPQ, or MSLQ, e.g., Gijbels et al., 2017) tap into individual differences in student learning. On the other hand, professional online student feedback platforms have been developed, integrating student learning surveys to provide feedback to students in their transition to higher education, such as HowULearn (Parpala & Lindblom-Ylänne, 2012) or Columbus (Demulder, Lacante & Donche, 2021). These feedback platforms often generate feedback on how students generally cope with learning in terms of their cognitive, metacognitive, motivational and/or emotional aspects. Although the construct validity and reliability of student learning surveys are often indicated substantially (Vermunt & Donche, 2017), there is a lack of attention to the reliability of the measurement on the individual level (Iaconnelli & Wolters, 2020). This is quite remarkable since students are also often provided in these contexts with individual feedback on their aspects of learning without attention to the possible phenomenon of careless responding (Curran, 2016). However, careless responding behaviour (CR) or biased survey responses can compromise the quality of individual feedback, especially if a student fills in the requested student survey carelessly or inattentively.
The prevalence of CR is an understudied phenomenon in research on student learning (Chauliac et al., 2022). Studies taking into account that not all survey data on student learning might be that appropriate for analysis use outlier analysis or inspection of skewness of the data to exclude cases from the dataset. Often, the Mahalanobis Distance index, a multivariate outlier detection method (Yentes & Wilhelm, 2018), is applied at the scale level in studies assessing the construct validity of instruments. However, this does not resolve the case of investigating the prevalence of careless responding at the individual respondent and item level. In research on student learning, surveys are still considered an important research instrument to measure the psychological processes that go along with learning through self-reports (Pekrun, 2020). Far less is known about the relationship between the prevalence of careless responding and the quality of this type of survey data and results. Evidence about the impact of CR on aspects of reliability and validity has been reported in the literature, such as in personality research or other fields of interest (Ward & Mead, 2023). Still, there is a paucity of research on this phenomenon in student learning survey research (Iaconnelli & Wolters, 2020).
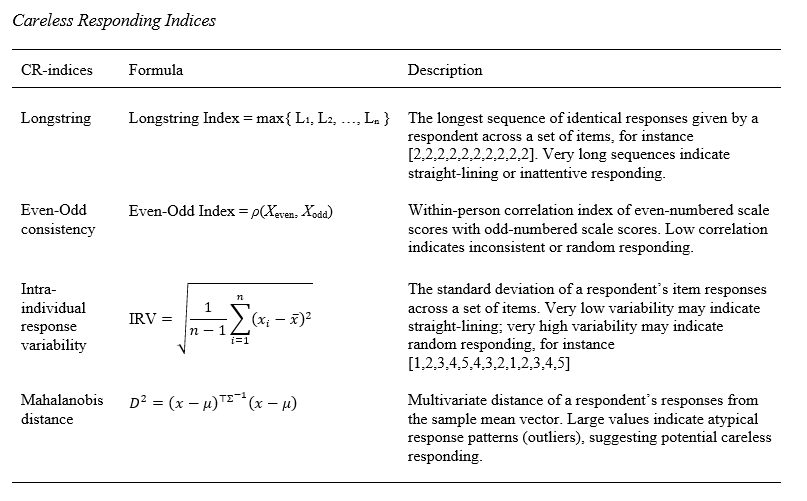
The first aim of this study is to provide insight into how the prevalence of CR in survey research on student learning can be examined using an unobtrusive post hoc detection approach (research question 1). This approach is valuable if a researcher has not implemented proactive indicators of careless responding, such as bogus items or direct questioning about how students have responded to survey items. In most survey research on student learning, little to no attention is given to these screening indicators for careless responding. Following the guidelines of Curran (2016) and former CR studies (Ward & Meade, 2023), we propose a complementary set of four post hoc CR indicators (Table 1). First, the Longstring index can be computed for each respondent, which results in an index of the longest sequence of identical answers given by a person, enabling the detection of the presence of so-called straight-lining response behaviour. Careless responders who do not want to be identified by this visual data response pattern might engage in other careless response strategies. Therefore, we also include the intra-individual response variability index (IRV), which complements the Longstring analysis in mapping other intra-individual response variability patterns which are generally neglected by the latter technique. For instance, the IRV index enables the detection of not only highly consistent but also highly variable or random item response patterns. A third indicator is the Even-Odd consistency index, which complements the other indexes in calculating a within-person correlation coefficient based on two sets of even and odd item scores across a survey. The Even-Odd consistency index can only be applied in the case of well-validated scales (with at least four items), assuring that the even versus odd item sets map unidimensional constructs. High scores on the Longstring index, IRV and low scores on the Even-Odd consistency index indicate more careless responding (Curran, 2016; Marjanovic et al., 2015; Yentes & Wilhelm, 2018). By including the Mahalanobis distance at the scale level as a fourth indicator, we also consider the presence of multivariate outliers. Using this complementary set of four indicators, at the item and scale level, we can compensate for the boundaries of identification when using single indices. As the identification of careless responders in a dataset needs to be based on multiple points of information to avoid a single method or selection bias (Curran, 2016), we extend the identification of careless responders on separate indicators by examining the presence of different data response profiles. We expect, in line with former CR research, to find a distinction between inattentive/careless or attentive/careful groups or profiles of responders (Meade & Craig, 2012), but also other subsamples that may be present in careless responder groups (Ward & Meade, 2023).
The second aim of this study is to extend research by further exploring the impact of CR profiles on data quality, specifically in the context of variables mapping metacognitive, motivational and emotional aspects of student learning (research question 2). Based on previous research, data collected within careless responder groups may raise concerns regarding reliability and validity (Ward & Meade, 2023). In former studies, different internal consistency levels have been found among different responder groups, and also related to these are differences in mean scores on measured constructs (Iaconnelli & Wolters, 2020). CR has also been found to be related to differences in the correlational structure of data (Kam, 2019) and also seems to impact results when applying hypothesis testing (Huang, Liu & Bowling, 2015; Maniaci & Rogge, 2014). Therefore, we will also test a well-investigated relationship in the literature among self-efficacy, anxiety, and procrastination (Yerdelen, McCaffrey & Klassen, 2016), illustrating the possible impact of CR on data quality.
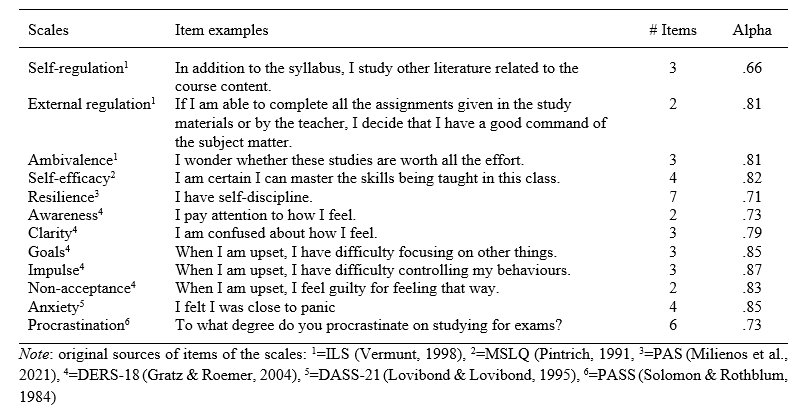
We used data from the PAS project , an international research project aiming to develop an online platform to assess and provide first-year university students with feedback on their learning and study progress. By convenience sampling, data were collected in three countries (Greece, Italy, and Belgium) at three universities. The sample consisted of 1,111 first-year students, of whom 78% were female. Informed consent in compliance with the ethical regulations and guidelines established by the Ethics Committee of the involved universities was obtained from all participants before the administration of the questionnaires. All students filled in the PAS questionnaire completely with shortened scales of internationally validated questionnaires (see also Milienos et al., 2021). Table 2 represents the internal consistencies of the 12 Likert scales with five answering options used in this study and their theoretical background sources, assessing different metacognitive, motivational, and emotional aspects of student learning.
Overview of 12 Scales of the PAS Survey, Item Examples, Number of Items and Internal Consistencies
In the first step, we assessed the theoretically expected latent structure of the PAS survey using Confirmatory Factor Analysis (CFA using the weighted least squares method). Related to the different sources of the instruments in the questionnaire, three CFA models (Appendix, Table A) were tested using the R-package lavaan (Rosseel, 2012). The fit of the models was tested with standard indices: Comparative Fit Index (CFI), Normed Fit Index (NFI), Tucker-Lewis Index (TLI), Goodness-of-Fit Index (GFI), Adjusted Goodness-of-Fit Index (AGFI), Root Mean Square Error Approximation (RMSEA) and Standardized Root Mean square Residual (SRMR). In models 2 and 3, three and one covariances were included between residual/error terms associated with indicators only from the same scales. The three CFA models showed acceptable fit indices, with CFI, NFI, TLI, GFI, and AGFI > 0.90, RMSEA <.08, and SRMR <.05 (see, e.g., Kline 2023). The similar testing of the construct validity of the instruments is a common approach in student learning research. However, the possible presence of CR in the data was not considered. In the following steps, we further investigate how careless responding can be identified and how it might affect data quality.
To identify CR in the data (research question 1), for each respondent we computed all four post hoc CR indicators, namely the Longstring index, the IRV, the Mahalanobis Distance and the Even-Odd consistency index using the R-package careless and following the guidelines for computing these indices in the accompanying open source reference manual (Yentes & Wilhelm, 2018). All analyses were conducted on the full sample of 1,111 respondents. However, the computation of certain careless responding (CR) indices was conditional on item availability. Specifically, the Even-Odd Consistency Index was only calculated for scales containing at least four items, namely, self-efficacy, resilience, anxiety, and procrastination. The other three CR indices (Longstring Index, IRV, and Mahalanobis Distance) were computed using all available item responses per individual. No respondents were excluded from the sample due to missing data, and all subsequent analyses were based on the complete sample. This approach ensured consistency in sample size across analyses, while acknowledging that some CR indices were not applicable to all scales.
To examine the presence of different responder profiles in the data, a latent profile analysis (LPA) was applied based on the four CR indices using the R-package tidyLPA (Rosenberg et al., 2018) and mclust (Scrucca et al., 2016). We applied ANOVA, calculated omega squared, and post hoc testing to explore differences between groups. The impact of CR profiles on data quality and outcomes (research question 2) was examined in three steps. In the first step, we analysed if the internal consistency levels were significantly different among responder profiles using Feldt’s tests (see also Diedenhofen & Musch, 2016). In the second step, descriptive statistics (means and standard deviations) were inspected among responder groups, and differences were tested via ANOVA, including multiple pairwise comparisons using Games-Howell Post hoc Tests. In a third step, we illustratively examined the measurement invariance of a specific well-studied hypothetical model across responder profile groups (including or excluding CR profiles) by applying multiple group structural equation modelling (SEM) in the R-package lavaan (Rosseel, 2012).
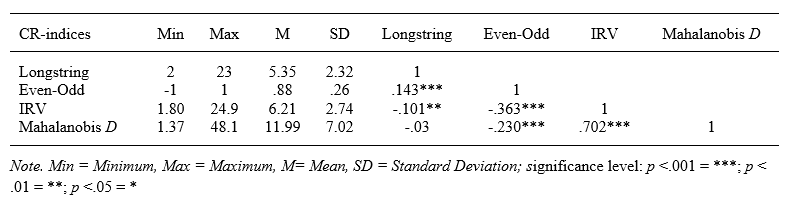
A first inspection of the descriptives of the different calculated CR indices shows the variance within and relationships between the four CR indicators in the dataset (Table 3). Straight-lining response behaviour as indicated by the Longstring index, with, in the case of 2 SD, points at a repeated set of at least 10 equal answers to specific survey questions. There is a weak but meaningful correlation between this index and the Even-Odd consistency index, which is plausible, given that less variance in answering questions seems to be related to more consistent responding to some extent. Also, as theoretically expected, the IRV index and Mahalanobis D are negatively correlated with the Even-Odd consistency index. More intra-individual response variability is likely to go along with less consistency in the choice of the answering options to questions. Moreover, there is little overlap between the different CR indices, except to some extent for IRV and Mahalanobis D (r = .702), which also underlines their expected complementarity. The results also suggest the potential added value of including IRV for outlier detection.
Descriptive Statistics of CR Indices and Pearson Correlations
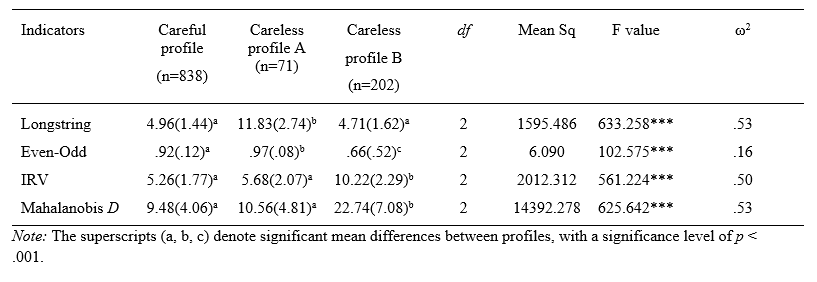
The subsequent LPA analyses enabled the examination of homogeneous subgroups of responders in terms of their scores on the four careless response indicators (z-scores). We inspected one to five profile models in the dataset to examine the number of profiles to be retained. Improving BIC and AIC values and comparing the entropy values (Appendix, Table B) were used as indicators for the goodness of fit (Nylund, Asparouhov, & Muthen, 2007; Rosenberg et al., 2018). Based on the statistical indicators, a four-profile model identification could be selected. After further inspection of the explained variance of the four versus three-profile model and taking into account parsimony (avoiding very small subgroup solutions) and theoretical interpretation (Meade & Craig, 2012), a three-profile model was preferred. The four-profile model also included a small group (2.3% of the total group) with a considerable overlap of features of one of the profiles in the three-profile model, making it less interesting for further analysis. Table 4 shows an overview of the CR indices of the three profile groups of responders, making a significant distinction between a large careful responder profile group (75.2% of the total group) and two different careless responder profile groups. A distinct feature of CR profile group A (6.4%) is the presence of more straight-lining response patterns, while within CR profile group B (18.4%), more random response data patterns occur. The three groups also differ regarding their Even-Odd consistency levels, showing the lowest level among the more random responder group.
Descriptive Statistics (Means and between brackets Standard Deviations) of the CR Indices for each Profile, along with Significance Tests (ANOVA), Effect Size (ω2), and Multiple Pairwise Comparisons (Games-Howell Post hoc Tests)
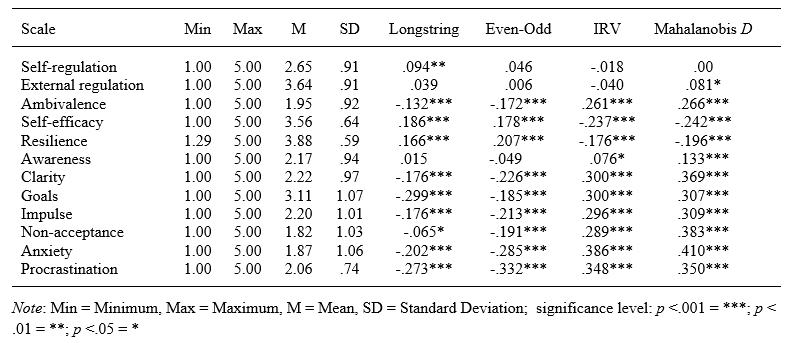
A first inspection of the associations between the 12 student learning survey scales (Table 5), which tap different aspects of metacognition, motivation, and emotion, shows correlations with almost all CR indices. This is, for instance, evidenced in the moderate correlations between anxiety and procrastination and all four CR indices. Some scales, such as the scales of self-regulation and external regulation, are almost not correlated with the CR indices.
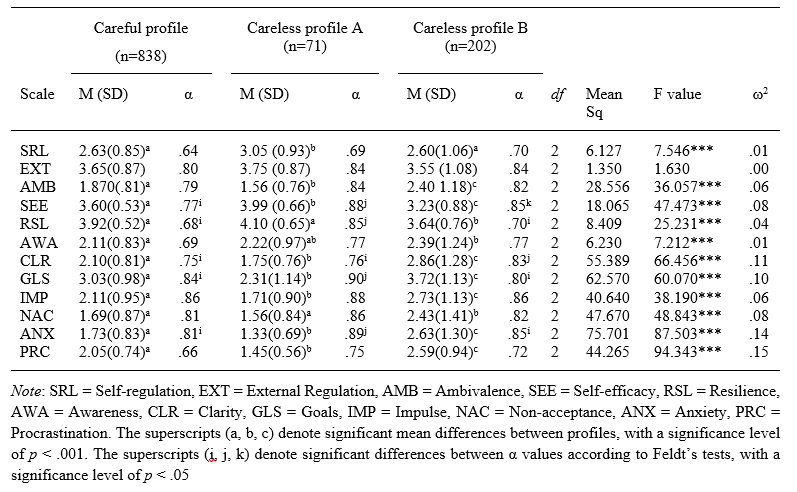
In the second step, we investigated the internal consistency levels of the scales between the different responder groups (Table 6). The internal consistency levels for half of the scales are mostly higher within the careless responder groups than the careful responder group. Feldt’s tests indicate that internal consistency levels are boosted more within the careless profile group A, which may be expected due to the prevalence of more straight-lining data patterns within this responder group. Next, we inspected the means and standard deviations between the responder groups. Small to medium effect sizes were found, indicating that all three responder groups significantly differed in their means on 7 out of 12 scales. Substantial effects were found for the scales measuring anxiety and procrastination. The careless profile group B, comprising respondents who are more prone to random response behaviour, showed larger standard deviations in general on the scales. The results demonstrate how CR may also influence the results regarding student learning on a group level.
Means, Standard Deviations, Internal Consistency and Differences between Responder Profile Groups along with Significance Tests (ANOVA), Effect Size (ω2), Multiple Pairwise Comparisons (Games-Howell Post hoc Tests) and Feldt’s Tests.
In the final step, we applied multigroup structural equation modelling (SEM) to assess a well-investigated relationship between self-efficacy, anxiety, and procrastination. This exemplary analysis is only intended to examine further whether CR may affect the fit of a hypothetical model in different responder groups. Using a conceptual replication analysis, we tested if the hypothesised stronger and negative relationship between self-efficacy and procrastination holds when taking anxiety into account (see also Yerdelen et al., 2016). We investigated this hypothesis by comparing the parameters in the careful and careless samples (including CR profile groups A and B). A joint-constrained model where the parameters across groups were constrained was compared with a non-constrained model in which the parameters were freely estimated using the difference in Chi-square statistic (Appendix, Table C). Testing of the equivalence of the loadings and structural relationships resulted in the rejection of the constrained model (p <.05), providing evidence of non-equivalence of the parameter estimates in both samples.
Standardised Path Coefficients and Factor Loadings of the Multigroup SEM model (Unconstrained Model) on Procrastination, jointly estimatd in the Careful versus Careless Sample (between brackets)
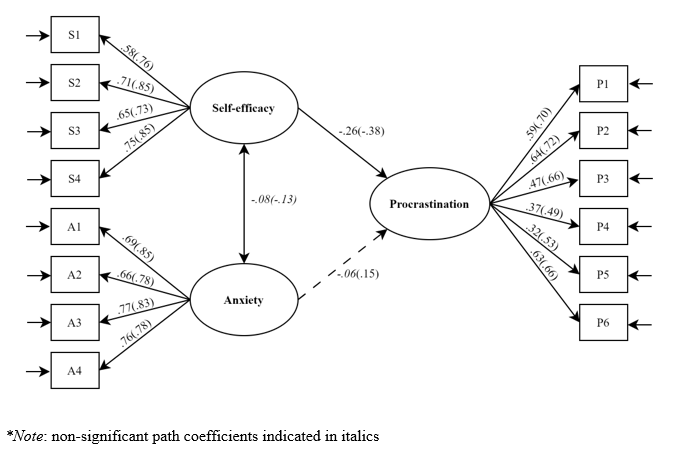
In both samples, and in line with the first part of the hypothesis, procrastination was found to be negatively predicted by self-efficacy. The strength of the relationship was slightly different in the careful versus careless sample (respectively, β = -.26, -.38, p < .001). In addition, the SEM results in these samples showed different effects on the role of anxiety (Figure 1, dashed line). In the careless sample, a small positive and significant relationship was found between anxiety and procrastination (respectively, β = .15, p < .05). In contrast, in the careful sample, this significant effect was not present (β = -.06). The hypothesised model could only be confirmed in the careful sample (Yerdelen et al., 2016), which further demonstrates that the noise present in the CR sample can obscure the estimation of relationships between variables.
While self-report questionnaires are often used in higher education to give students individual feedback on their learning, research on how students fill in these questionnaires and how this may influence data quality is generally lacking. The first aim of this study was to investigate the prevalence of careless responding in a survey on student learning using four complementary post hoc indicators and to seek the presence of different responder profiles, as indicated in former studies in other domains of interest (Ward & Meade, 2023). In line with these studies, a group of responders showing more attentive or careful response behaviour, as well as careless responder groups, could be identified. Rather than contrasting careful from careless response behaviour, the identification of more straight-lining or more consistent versus more variable or random response behaviour was found, which relates to former research results (Ward & Meade, 2023). Straight-lining behaviour is minorly represented (6.4%) compared to more random response behaviour (18.4%), but both profiles of careless responding form an important subsample of almost 25% in the present data. According to the literature, the proportion of careless responding can vary substantially across studies, between 1% and 30% (Curran, 2016) or, more extremely, even up to 50% (Ward & Meade, 2023). However, these percentages also depend on how CR indicators are used to identify careless responding in samples. The second aim explored the impact of CR profiles on data quality. The results obtained from the inspection of differences in descriptive statistics, consistency levels, and the examined relationships between variables show the relative but not unimportant impact of CR. Some latent constructs measured, such as anxiety and procrastination, might be more prone to CR. In the illustrative example of an inspection of the structural relationship between self-efficacy, anxiety and procrastination, obscuring effects were found of CR with regard to the expected structural relationships between variables. This example illustrated how CR can impact not only the data quality but also the outcomes of a study.
A methodological limitation in this study concerns the differential treatment of missing data across the computed CR indices. While all analyses were conducted on the full sample of 1,111 respondents, the Even-Odd consistency index was only calculated for scales with at least four items, resulting in partial data usage for this indicator. This selective computation may have influenced the sensitivity of the latent profile analysis (LPA), as the Even-Odd consistency index contributed to profile differentiation only based on a subset of scales. Although the use of complete data for the other three CR indices ensured comparability of the profile models, the uneven contribution of the Even-Odd consistency index could affect the interpretation of the responder profiles.
For future research, it is important to further understand the key factors that are related to the presence of CR. Some studies point to the role of personality traits that might explain why responders are more careless (Dunn et al., 2018). Still, CR might also be related to other factors during survey taking, such as the length of the survey, the type of item questions, or the high-stakes versus low-stakes conditions of test-taking (Ward & Mead, 2023). The presented unobtrusive approach to detecting CR using four post hoc indicators in online student learning surveys, and identifying responder profiles, can be further improved. A fifth complementary indicator regarding online surveys could be response time, which is often automatically registered on online survey platforms but was unavailable for this study. Former research already indicated the value of investigating the response time of survey completion in addition to other CR measures (Goldammer et al., 2024; Iaconelli & Wolters, 2020). Adding response time indicators to items or pages of an online survey can be valuable in detecting carelessness in effort-taking among respondents. It can identify response times that are too short and processes of slowing down, speeding up, or even dropping out during survey-taking. More mixed-method research is needed to shed further light on whether responders are more careless due to inattention or (temporarily) deliberate action, or what conditions or situations might trigger more CR behaviour. The sample used in the study was limited to first-year university students who completed all survey items in a low-stakes condition of test-taking, and more insight into other populations is needed to generalise findings. It might be the case that CR is more present among this particular population, and is also related to a more challenging data collection period, as many first-year students then cope with their transition to higher education. No research has examined the role of affective-motivational experiences or states during survey taking or examined these processes in-depth among different subgroups, such as, for instance, students experiencing mental health problems or having defence styles towards learning (Vlachopanou & Karagiannopoulou, 2021). Additional interviews and stimulated recall interviews using eye-tracking data when students fill in questionnaires could, therefore, be interesting to unravel these possible factors, triggers or mechanisms and contribute to more knowledge about the process of survey taking in relation to the data quality and context (Chauliac et al., 2022).
This study provided a feasible and unobtrusive post hoc way of testing the presence of CR profiles in a given dataset in the context of student learning, and the approach may also be valuable for replication in future student learning research in which self-reports are an important measurement instrument. The study highlighted the importance of incorporating CR analyses when examining data quality and relationships in online student learning survey data. These insights are essential to making more informed decisions as a researcher about including or excluding questionable data from online survey research. An important benefit of the suggested approach is that not a single but several indices are used, which resonates with former suggestions in the CR literature (Curran, 2016; Iaconelli & Wolters, 2020; Ward & Meade, 2023). We also illustrated how a parsimonious set of four indices could already help distinguish different responder profiles. When data and relationships among variables are investigated for feedback purposes on aggregated or individual levels, CR analyses and identification of CR profiles are important. Also, these insights are relevant for practice, especially when teachers and counsellors inform or guide students based on data collected in online surveys or feedback platforms in higher education. Providing a sign of warrant in individual survey-based feedback reports or communication when multiple CR indices point to a more careless responder profile can be a practical implication to ensure the quality of the information in feedback practices.
Chauliac, M., Catrysse, L., Gijbels, D., De Maeyer, S., &
Donche, V. (2022). Self-report questionnaires scrutinised: Do eye
movements reveal individual differences in cognitive processes
while completing a questionnaire? International Journal of
Social Research Methodology, 26 (4), 391–407.
https://doi.org/10.1080/13645579.2022.2052696
Curran, P. G. (2016). Methods for the detection of carelessly
invalid responses in survey data. Journal of Experimental
Social Psychology, 66 , 4-19.
https://doi.org/10.1016/j.jesp.2015.07.006 Demulder, L.,
Lacante, M., & Donche, V. (2021). Large-scale measurements to
support students in their transition to higher education: The
importance of including a non-cognitive perspective. In E. Braun
(Ed.), Research on teaching and learning in higher education
(pp. 11-20). Waxman.
Diedenhofen, B., & Musch, J. (2016). Cocron: A web interface
and R package for the statistical comparison of Cronbach’s alpha
coefficients. International Journal of Internet Science, 11(1),
51–60.
https://www.ijis.net/ijis11_1/ijis11_1_diedenhofen_and_musch.pdf
Dunn, A. M., Heggestad, E. D., Shanock, L. R., & Theilgard, N.
(2018). Intra-individual response variability as an indicator of
insufficient effort responding: Comparison to other indicators and
relationships with individual differences. Journal of
Business and Psychology, 33(1), 105-121.
https://doi.org/10.1007/s10869-016-9479-0
Gijbels, D., Donche, V., Richardson, J. T. E., & Vermunt, J.
D. (Eds.). (2014). Learning patterns in higher education:
Dimensions and research perspectives . New York:
Routledge.
Goldammer, P., Stöckli, P. L., Escher, Y. A., Annen, H., Jonas,
K., & Antonakis, J. (2024). Careless responding detection
revisited: Accuracy of direct and indirect measures. Behaviour
Research Methods, 56, 8422–8449.
https://doi.org/10.3758/s13428-024-02484-3
Gratz, K. L., & Roemer, L. (2004). Multidimensional assessment
of emotion regulation and dysregulation: Development, factor
structure, and initial validation of the difficulties in emotion
regulation scale. Journal of Psychopathology and Behavioral
Assessment, 26 , 41–54.
https://doi.org/10.1023/B:JOBA.0000007455.08539.94
Huang, J. L., Liu, M., & Bowling, N. A. (2015). Insufficient
effort responding: Examining an insidious confound in survey data.
Journal of Applied Psychology , 100(3),
828–845.
https://doi.org/10.1037/a0038510
Iaconelli, R., & Wolters, C. A. (2020). Insufficient effort
responding in surveys assessing self-regulated learning: Nuisance
or fatal flaw? Frontline Learning Research, 8 (3),
104-125.
https://doi.org/10.14786/flr.v8i3.521
Kam, C. C. S. (2019). Careless responding threatens factorial
analytic results and construct validity of personality measure.
Frontiers in Psychology, 10 , 1258.
https://doi.org/10.3389/fpsyg.2019.01258
Kline, R. B. (2023). Principles and Practice of Structural
Equation Modeling (5th ed) . New York, NY: Guilford
Press.
Lovibond, S., & Lovibond, P. (1995). Manual for the
Depression Anxiety Stress Scales . Sydney, NSW: School of
Psychology, University of New South Wales.
https://doi.org/10.1037/t01004-000
Marjanovic, Z., Holden, R., Struthers, W., Cribbie, R., &
Greenglass, E. (2015). The inter-item standard deviation (ISD): An
index that discriminates between conscientious and random
responders. Personality and Individual Differences, 84
, 79-83.
https://doi.org/10.1016/j.paid.2014.08.021
Meade, A. W., & Craig, S. B. (2012). Identifying careless
responses in survey data. Psychological Methods, 17,
437–455. https://doi.org/10.1037/a0028085
Milienos, F., Rentzios, Ch., Catrysse, L., Gijbels, D.,
Mastrokoukou, S., Longobardi, C., & Karagiannopoulou, E.
(2021). The contribution of learning and mental health variables
in first-year students’ profiles. Frontiers in Psychology,
12 , 627118.
https://doi.org/10.3389/FPSYG.2021.627118
Nylund, K. L., Asparouhov, T., & Muthen, B. O. (2007).
Deciding on the number of classes in latent class analysis and
growth mixture modeling: A Monte Carlo simulation study. Structural
Equation Modeling, 14, 535–569. https://doi.org/10.1080/10705510701575396
Parpala, A., & Lindblom-Ylänne, S. (2012). Using a research
instrument for developing quality at the university. Quality
in Higher Education, 18 (3), 313–328.
https://doi.org/10.1080/13538322.2012.733493
Pekrun, R. (2020). Commentary: Self-report is indispensable to
assess students’ learning. Frontline Learning Research, 8(3),
168-194.
https://doi.org/10.14786/flr.v8i3.637
Pintrich, P. R., Smith, D. A. F., García, T., & McKeachie, W.
J. (1991). A Manual for the Use of the Motivated Strategies
for Learning Questionnaire (MSLQ) . Ann Arbor, MI:
University of Michigan, National Center for Research to Improve
Postsecondary Teaching and Learning.
Rosenberg, J. M., Beymer, P. N., Anderson, D. J., Van Lissa, C.
J., & Schmidt, J. A. (2018). tidyLPA: An R package to easily
carry out latent profile analysis (LPA) using open-source or
commercial software. Journal of Open Source Software, 3
(30), 978.
https://doi.org/10.21105/joss.00978
Rosseel, Y. (2012). lavaan: An R package for structural equation
modeling. Journal of Statistical Software, 48(2), 1–36.
https://doi.org/10.18637/jss.v048.i02
Scrucca, L., Fop, M., Murphy, T. B., & Raftery, A. E. (2016).
mclust 5: Clustering, classification and density estimation using
Gaussian finite mixture models. The R Journal, 8(1),
205-233.
https://journal.r-project.org/archive/2016/RJ-2016-021/RJ-2016-021.pdf
Solomon, L. J., & Rothblum, E. D. (1984). Academic
procrastination: Frequency and cognitive-behavioral correlates.
Journal of Counseling Psychology, 31 , 503.
https://doi.org/10.1037/0022-0167.31.4.503
Yentes, R., & Wilhelm, F. (2018). Careless (Version 1.1.3)
[Computer software].
https://cran.r-project.org/web/packages/careless
Yerdelen, S., McCaffrey, A., & Klassen, R. M. (2016).
Longitudinal examination of procrastination and anxiety, and their
relation to self-efficacy for self-regulated learning: Latent
growth curve modeling. Educational Sciences: Theory &
Practice, 16(1), 5-22.
https://doi.org/10.12738/estp.2016.1.0108
Vermunt, J. D. (1998). The regulation of constructive learning
processes. British Journal of Educational Psychology, 68,
149–171.
https://doi.org/10.1111/j.2044-8279.1998.tb01281.x
Vermunt, J. D., & Donche, V. (2017). A learning patterns
perspective on student learning in higher education: State of the
art and moving forward. Educational Psychology Review, 29,
269–299.
https://doi.org/10.1007/s10648-017-9414-6
Vlachopanou, P., & Karagiannopoulou, E. (2021). Defense
styles, academic procrastination, psychological wellbeing and
approaches to learning: A person-oriented approach. Journal
of Nervous and Mental Disease, 210 (3), 186-193.
https://doi.org/10.1097/NMD.0000000000001423
Ward, M. K., & Meade, A. W. (2023). Dealing with careless
responding in survey data: Prevention, identification and
recommended best practices. Annual Review of Psychology, 74,
577-596. https://doi.org/10.1146/annurev-psych-040422-045007