![]()
Frontline Learning Research Vol.13 No. 3 (2025)
83 - 107
ISSN 2295-3159
1Behavioural Science Institute,
Radboud University, Nijmegen, The Netherlands
2National Education Lab
Artificial Intelligence, Radboud University, Nijmegen, The
Netherlands
Article received 4 April 2024 / revised 10 October 2025 / accepted 13 October 2025 / available online 3 June 2026
This study explored how learners engage in shared control in math in Adaptive Learning Technologies (ALT). In shared control, learners adjust task difficulty (easy, medium, or hard), while the ALT selects tasks based on performance. These adjustments to task difficulty influence the probability of solving the next task correctly. This study aimed to understand (1) differences in how learners use shared control and (2) how this relates to general math ability, regulation of practice behaviour (number of finished problems and accuracy), and learning outcomes. In this exploratory study, 98 grade 5 learners practiced three math topics using an ALT combined with an app, including personalised visualisations of learners’ real-time progress on the math topics and shared control selection options. Results showed four clusters reflecting differences in learners’ use of shared control in quantity and direction of task difficulty changes: learners making no changes (cluster 1), learners making some changes preferring hard difficulty (cluster 2) or easy difficulty (cluster 3), and learners who frequently changed across all task difficulties (cluster 4). Shared control was related to general math ability and influenced learners’ regulation of practice behaviour. Although a comparison with the ALT control was absent, learners seem to choose task difficulties in line with their needs and benefit from these choices, resulting in learning gain. From a self-regulated learning perspective, this indicated how learners engaged in regulation and were aware of their needs.
Keywords: Shared control, Adaptive Learning Technologies, Self-regulated learning, Practice behaviour, Hybrid Human-AI Regulation
Effective learning during practice requires tasks of desirable difficulty, aligned with learners’ knowledge and skills (Bjork & Bjork, 2014; Bjork, 1994). Learners commonly encounter challenges when selecting such tasks since they often lack the needed self-regulated learning (SRL) skills (e.g., Greene & Azevedo, 2010). Adaptive learning technologies (ALTs) can solve this problem by selecting tasks for learners (Plass & Pawar, 2020). However, relying solely on ALTs for task selection reduces opportunities for learners to develop their SRL skills, which are crucial for deeper and lifelong learning (Brod et al., 2023; Molenaar, 2022; Winne, 2018). Hence, in shared control, learners are offered some control in addition to the ALTs task selection by choosing task difficulty. Learners can choose whether they want the ALT to select easy, medium, or hard tasks for them. The probability of solving the next tasks the ALT selects then increases or decreases accordingly until the learner changes difficulty level again. Little is known about how primary school children will use this type of shared control with an ALT and how this is associated with their practice behaviour and learning outcomes. Practice behaviour is quantified in the number of problems solved and the accuracy thereof (Molenaar et al., 2019). The learning outcome is reflected in learning gain: the difference between learners’ prior and post-practice knowledge. ALTs are often used to practice math (Karssen et al., 2023). Therefore, the current study explored individual differences in how learners in upper primary school use shared control during math lessons with an ALT and investigated how these differences relate to general math ability, practice behaviour, and learning outcomes.
During practice, it is crucial to initiate processes that facilitate learning, comprehension, and retention (Bjork & Bjork, 2014; Bjork, 1994). Learning tasks should be at the right difficulty level for learners. Such tasks of desirable difficulty are in the learners’ zone of proximal development and slightly exceed the learner’s current knowledge and skills while providing enough challenge for learners to invest enough mental effort to solve the task (Bjork, 1994; Vygotsky, 1980). Next to content-related knowledge and support, the ability to select tasks of desirable difficulty largely relies on learners’ SRL skills (Bjork et al., 2013).
SRL is a goal-driven process that includes active involvement by the learner (Greene & Azevedo, 2007; Usher & Schunk, 2018; Winne & Hadwin, 1998). This means learners actively set goals and continuously monitor and control actions (Nelson, 1990; Winne, 2018; Winne & Hadwin, 1998). Monitoring entails keeping track of one’s performance and evaluating the progress toward the self-set goals. Control refers to adjusting the learning process to enhance progress toward this goal. Monitoring and control, thus, are intertwined: to select tasks that suit their needs and help them achieve their performance goal, learners must self-assess their learning and evaluate their progress (Kostons et al., 2010). Research consistently shows that learners struggle with both parts of SRL: monitoring and control (e.g., Greene & Azevedo, 2010; Wilcox, 2023); consequently, many learners face challenges in task selection (Kostons et al., 2010; 2012).
One way to support learners in task selection is to have ALTs control task selection, adjusting the task difficulty to the learner’s performance in real time (Klinkenberg et al., 2011; Plass & Pawar, 2020). ALTs modify task difficulty based on the probability that the learner can solve the task correctly, often set at 75% (Klinkenberg et al., 2011). In this way, the selected tasks provide sufficient challenge while meeting learners’ prior knowledge and skills, fulfilling the requirements for desirable difficulty (i.e., Bjork & Bjork, 2014; Bjork, 1994). Adaptive task selection was found to lead to higher learning outcomes compared to non-adaptive technologies in primary- and secondary education (Aleven et al., 2016; Faber et al., 2017; Jansen et al., 2013; Molenaar et al., 2017; Plass & Pawar, 2020). However, fully automated task selection hampers learners’ opportunity to practice SRL skills (Brod et al., 2023; Molenaar, 2022). Hence eliminating learners’ control over task selection is not always recommended despite the positive effects on learning. Shared control embedded in an ALT may be a promising solution to address this issue.
Shared control enables learners to participate in task selection together with the ALT actively. In shared control, learners control task selection by choosing whether they want the ALT to select easy, medium, or hard tasks for them. The probability of solving the next tasks the ALT selects then increases or decreases accordingly until the learner changes difficulty level again. Hence the learner and the ALT determine the next task’s difficulty together. For example, when a learner selects the easy difficulty, the ALT adjusts the probability of a correct answer on the next task from 75% to 85%. This learner-driven approach retains the adaptive benefits of system-controlled task selection while empowering learners to take an active role, ensuring alignment with their current knowledge and skills (Jansen et al., 2016; Molenaar, 2022). By involving learners in this process, shared control bridges the gap between full learner control, which risks misaligned task selection, and full ALT control, which may lack learner autonomy.
As mentioned, SRL skills are needed to make effective task selection decisions within shared control (Bjork et al., 2013). SRL begins with learners setting performance goals, which serve as a reference point for the monitoring process (Winne, 2018; Winne & Hadwin, 1998). In shared control, learners compare their progress to these self-set goals to determine whether control actions such as adjusting task difficulty are necessary (Kostons, et al., 2010). However, research indicates that the cognitive load imposed upon the learner by a task can hinder learners from effectively applying SRL skills, even when they possess them (Dignath et al., 2008; Seufert, 2018). This underscores the importance of external support tools to help learners navigate these challenges in shared control.
Personalised visualisations are a promising tool for external SRL support in shared control settings (Molenaar et al., 2020a). These visualisations use real-time trace data to provide performance feedback to learners. This off-loads cognitive load imposed by monitoring, mitigates monitoring problems (Foster et al., 2017), and helps learners in cognitive evaluations comparing progress to self-set learning goals, thereby supporting learners’ monitoring and helping them develop appropriate control actions (Molenaar et al., 2020a; Winne, 2017). Research has demonstrated the effectiveness of personalised visualisations, showing improved learner regulation of practice behaviour resulting in higher accuracy, more finished problems, and less overestimation of learning (Molenaar et al., 2019; 2020a).
Personalised visualisations also affect learners’ perspectives of the relation between the invested effort and learning (Baars et al., 2020). Learners tend to avoid using more effortful learning strategies even if these are more efficient for learning (e.g., Carpenter et al., 2020). This avoidance may result from a negative relation learners perceive between effort and their judgments of learning: higher effort often leads to the belief that less learning occurred (Baars et al., 2020). However, when learners actively choose to invest effort by setting their own goals, their perception shifts. They no longer report having learned less if the invested effort was high. By providing insights into the relationship between effort investment and goal achievement, personalised visualisations may help learners evaluate the impact of their control actions and help learners make more informed decisions. In this way, personalised visualisations are expected to further enhance learners’ effort investment, especially when combined with learners’ choice over difficulty levels in shared control.
Studies on shared control in task difficulty selection are inconclusive regarding its effects on learning outcomes (Jansen et al., 2016; Papoušek & Pelánek, 2017). Papoušek and Pelánek (2017) found, in the context of geography in secondary education, that choices for lower task difficulty hampered learning speed but increased motivation, while choices for higher task difficulty were related to higher learning speed without sacrificing motivation. In contrast, in an ALT controlled setting in math education in upper primary school, Jansen and colleagues (2013) associated lower task difficulty with more task completions and modest learning gain, while higher task difficulty led to fewer finished tasks and, subsequentially, lower learning gain. The findings of Papoušek and Pelánek (2017) are in favour of higher task difficulty, which improves learning outcomes and motivation in a shared control setting, while the study by Jansen and colleagues (2013) showed that a lower task difficulty leads to improved practice behaviour (a higher number of finished problems) and consequently learning outcomes in an ALT controlled setting.
Moreover, studies on shared control showed that learners differ in the task difficulty they choose (Jansen et al., 2016; Authors, 2024). For example, math ability and chosen task difficulty were positively related: upper primary school learners with a higher math ability tend to choose a higher task difficulty than learners with lower math ability (Jansen et al., 2016). However, Jansen and colleagues did not investigate whether those differences in chosen task difficulty affected learning gain. Differences in chosen task difficulty were also related to differences in motivation (Knoop-van Campen et al., 2024). For example, learners with higher intrinsic motivation often choose the hard difficulty. In summary, while studies demonstrate that learners make different choices regarding task difficulty based on factors like math ability and motivation, further research is needed to explore learners’ use of shared control and how this use relates to math ability, practice behaviour, and learning outcomes.
Shared control is a promising way to combine the positive aspects of automated task selection with learners’ engagement in task selection to develop their SRL skills. Previous research into shared control showed mixed results on practice behaviour and learning outcomes (Jansen et al., 2016; Papoušek & Pelánek, 2017). To be able to interpret the mixed results further and identify learners’ support needs to develop SRL in shared control, there is a need for more in-depth research into learners’ use of shared control and how this relates to general math ability, practice behaviour, and learning outcomes. Personalised visualisations were included in the shared control design to support awareness of learners’ own SRL process (Teasley, 2017; Verbert et al., 2014). This study is a first step toward personalised forward SRL support to help learners develop SRL skills (Molenaar, 2022). Since ALTs are often used in upper primary school to practice math (Karssen et al., 2023) and the positive relation between math ability and preferred task difficulty is found in upper primary school (Jansen et al., 2016), it is promising to start in this educational context on the topic of math. Therefore, in this exploratory study, we aimed to cluster shared control use by considering both the quantity and direction of task difficulty changes and how clusters relate to general math ability, practice behaviour, and learning outcomes. The following research questions were addressed:
(1) What clusters can be distinguished based on upper primary school learners’ use of shared control over adaptive task selection in ALTs in math?
(2) How do learners in these clusters differ in (a) general math ability, (b) practice behaviour, and (c) learning outcomes?
In this study, 108 5th-graders from four Dutch primary schools participated. The schools used the ALT for their math lessons daily. After excluding learners who attended less than three out of four lessons (n = 6) and learners with technical issues (n = 4), the analysis included 98 learners. Their mean age was 11 years and 11 days (SD = 4 months and 19 days).
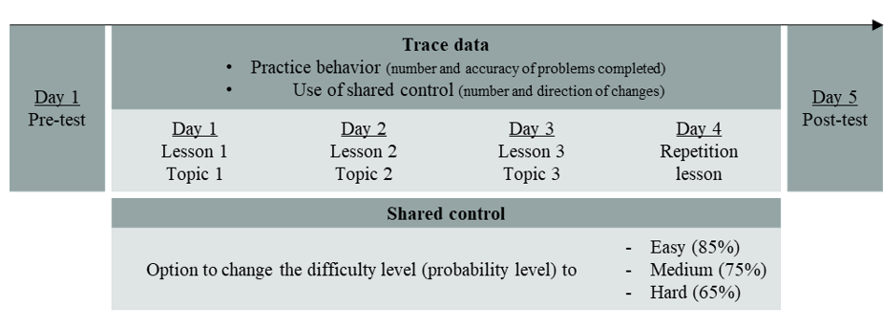
This study featured pre- and posttests in a natural classroom setting and four math lessons during one week (Figure 1). Learners worked on three consecutive math topics within the domain of volume and metrics during the first three lessons, followed by a repetition lesson in which learners could choose the topic(s) they wanted to repeat. Each lesson started with teacher-guided instruction on the topic, followed by adaptive practice in the ALT. Next to the ALT, learners used the Learning Path App, including personalised visualisations and shared control options. The study had a within-between-subjects design, with shared control use (clusters), general math ability, and practice behaviour as between-subject factors and learning (pre- and posttest) as within-subject factors.
Figure 1
Study design
Participating schools received an information letter, consented to participate, and signed a data processing agreement, allowing the sharing of trace data from the ALT with the university. Parents received an information letter and could object to their child’s data use. The data was anonymised. The university’s Ethics Committee has independently reviewed and approved the research [Radboud University: ECSW-2020-140]. Furthermore, the Ethics panel of the European Research Council (ERC) approved the research, and the ethical concerns related to this project are periodically monitored by an independent Ethics Advisor [grant no. 948786].
All lessons started with 20 minutes of standardised teacher-guided instruction on the topics and the interpretation and use of the personalised visualisations and shared control options. After the instruction, learners explicitly stated a goal by indicating the ability score they wanted to reach during the first lesson on a topic and at the end of the week. Then, learners started 30 minutes of adaptive practice, during which learners could consult the personalised visualisations and participate in shared control. Each lesson ended with a five-minute standardised plenary reflection activity guided by the teacher. The pretest on the three topics took place before the first lesson, and the posttest after all four lessons were finished.
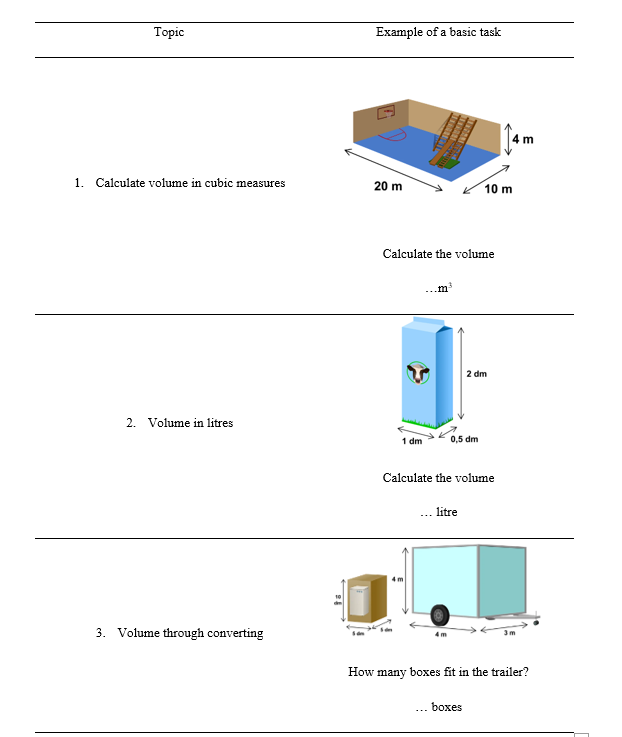
Table 1
The three topics within the domain of volume and metrics
2.4.1 Adaptive Learning Technology
The ALT used in this study, Gynzy®, is widely adopted across the Netherlands. After teacher-guided instruction, learners completed sets of twelve math problems using a laptop or tablet. They received immediate feedback after each problem. If a problem was answered incorrectly, a second chance appeared immediately. If needed, a third and final try was provided at the end of the problem set. The ALT adjusted learners’ ability scores and difficulty ratings of the problem after each finished problem set using a variant of the Elo algorithm (Klinkenberg et al., 2011). Since the ALT is widely adopted across the Netherlands, difficulty ratings of problems are based upon many attempts by a wide variation of learners and, therefore, considered well-calibrated. The ALT selected the next problem with a probability level of 75% (standard setting) for the learner based on problem difficulty ratings and learners’ ability scores. This probability level means that there is a chance of approximately 75% for the learner to solve the next problem correctly, based on the difficulty rating of the problem and the current ability rating of the learner. Teachers could follow learners’ progress on the problems in a teacher dashboard (Molenaar et al., 2019).
The learners worked on three consecutive topics in the volume and metrics domain in this study (see Table 1). The first topic involved easy problems requiring the application of the volume formula (volume = length x width x height). The second topic presented medium difficulty, requiring an additional step of converting cubic measures (cm3, dm3, m3) to litre units (ml, cl, l). For the third and most complex topic, learners had to calculate how many boxes fit in a bigger box, but the measuring units of both boxes differed. Unfortunately, data on the third topic had to be excluded from the analysis due to limited variation in problem difficulty on this topic within the ALT, leading to the unreliable impact of both adaptivity and shared control. The difficulty of the ALT problems of the excluded topic did not follow a normal distribution. Therefore, the impact of difficulty changes by the learners was minimal (e.g., when learners would select ‘easier’, the tasks would not become easier as there were no easier tasks). Therefore, we excluded the third topic from the analyses.
2.4.2 Learning Path App
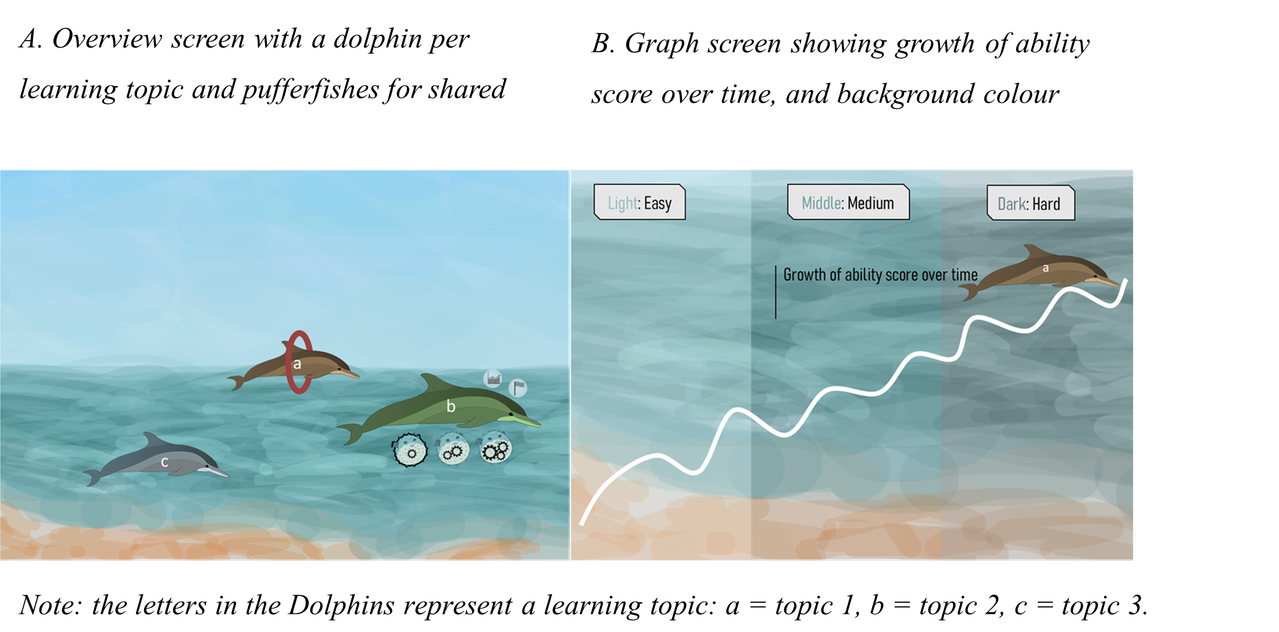
The Learning Path App (LPA) was available on a separate tablet next to the device used for the ALT. The LPA is designed to guide learners through the process of SRL: task orientation, goal setting, execution of the task, and making adaptations based on the COPES model (Winne & Hadwin, 1998). Before the learners started adaptive practice on a math topic, they were actively prompted to set a performance goal in the LPA. Learners set two goals by indicating the ability level they wanted to reach by dragging a flag on a scale of 0 to 100% proficiency: one flag for the end of the lesson on the math topic (lesson goal) and one for the end of the week (end goal). During adaptive practice, learners could consult personalised visualisations and shared control options in the LPA. The personalised visualisations showed their progress towards their self-set goals with a dolphin per math topic (Figure 2A), their growth in ability level per topic, and how this growth was related to the choices they made in difficulty level (Figure 2B), see Molenaar et al., (2020a).
The shared control option allowed learners to switch between three difficulty levels: easy, medium, or hard. The difficulty levels reflect a likelihood of approximately 85% (easy), 75% (medium), or 65% (hard) that the learner is able to solve the next problem correctly. The ALT selects problems based on the learner’s chosen difficulty level, relative to the learner’s ability score; a particular problem may be easy for one learner, but hard for another. Task difficulty was chosen by the learners using the pufferfish underneath the dolphin of the topic (Figure 2A). Learners were able to change the difficulty after each problem. However, they were instructed to look into the personalised visualisations and think about difficulty level changes after each set of 12 problems in the ALT. The time to practice was set at 25 minutes for each lesson. Moreover, specific information on learners’ choices in shared control was provided in the graph screen of the personalised visualisations (Figure 2B). The graph screen indicated the growth trajectory based on the development of learners’ ability score on a topic. The background colour of this screen indicated the chosen task difficulty. In this way, learners could evaluate the impact of the chosen task difficulty on the development of their ability score.
Figure 2
Shared Control in the Learning Path App
2.5.1 Use of shared control
Shared control was measured by the quantity and direction of changes in task difficulty executed by the learners based on trace data from the LPA. The number of changes measured the quantity. All changes in task difficulty on the two topics , including changes from the default probability level to higher or lower ones before the first round of adaptive practice, were counted. The direction of change was quantified by the percentage of changes towards the task difficulty; changes from medium to hard or from easy to hard were counted as changes to the hard task difficulty, the same was done for changes to easy, and changes from easy to medium or hard to medium were counted as changes to medium. The measure for the direction of change consisted of three variables (easy, medium, and hard) collectively summing to 100%. When learners made no changes, the percentages equated to 0%. The average chosen task difficulty was calculated as a weighted average of difficulty level based on the number of problems attempted at each difficulty level.
2.5.2 General math ability
General math ability for each learner was obtained from standardised tests administered twice a year in primary schools. The standardised tests used differed between schools. Therefore, the grade equivalent scores based on the tests were used. Grade equivalent scores are based on the median score on the standardised test for the number of months of formal education (didactic age). Learners who earned the median score for a given didactic age got the number of months of education as their score (McGarth, 2011). The scores ranged from 25 to 86 (M = 47.13, SD = 9.86). The grade equivalent scores were derived from tests administered halfway through grade 5; at this point, learners typically had 45 months of formal education. There was considerable variation in the scores.
2.5.3 Practice behaviour
To measure practice behaviour, the number and accuracy of the problems completed by the learner were used based on trace data from the ALT. The number of unique problems a learner completed on the first two1 topics was used. Accuracy was calculated by dividing the number of correctly answered problems by the total number of problems completed, resulting in a percentage.
2.5.4 Learning outcomes
To measure learning outcomes, the pre- and posttests were used. The difference between the scores on the pre- and posttest reflect learning gain. Both tests consisted of 16 items, eight for each topic1. Learners received one point for each correctly answered item. The test items were the same for all learners and differed between the tests. Based on the problem difficulty spreading of problems in the ALT, both tests included the same spreading of easy, medium, and hard problems within each topic. The Cronbach’s alpha’s of the math tests were considered reliable (α pretest = .76, α posttest = .68). Mean scores over both tests ranged between 0 and 15 (M = 6.56, SD = 2.62).
All analyses were conducted in R version 4.2.3 (R Core Team, 2023).
2.6.1 Clustering use of shared control
A K-means clustering was conducted to examine clusters on learners’ use of shared control (RQ1) with the variables on quantity and direction of changes in task difficulty (number of changes; changes to easy, medium, and difficult). The learners who made no changes were left out of the K-means clustering analysis and manually added as a separate cluster.
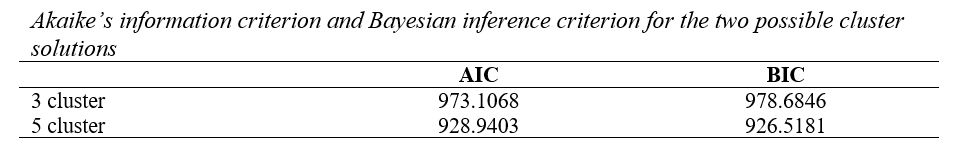
The optimal number of clusters was identified using the within-cluster sum of squares, the average silhouette, and the gap statistic (see Appendix A; Factoextra package; Alboukadel & Mundt, 2020). Solutions with three, five, six, or eight clusters were considered based on those statistics. Since aiming for a parsimonious solution that reflected differences in learners’ task selection behaviour, we further explored the K-means clustering solutions for three and five clusters (Cluster package; Maechler et al., 2022). Cluster graphs and descriptives on the variables included in the K-means clustering were extracted (see Appendix B). In addition, Akaike’s information criterion (AIC) and Bayesian inference criterion (BIC) were calculated (Kodinariya & Makwana, & 2013; Morgan, 2015). The difference between the values for both solutions was small (Appendix C). The three-cluster solution and the five-cluster solution both showed similar task selection strategies. Considering this and the sample size, the three-cluster solution was considered the best fit. The group of learners that made no changes in difficulty was manually added as the fourth cluster. A one-way ANOVA (with the aov function in R) with cluster as independent and average chosen task difficulty as dependent variable was performed to show differences in the average chosen task difficulty between the four clusters. Post-hoc tests (rstatix package, R, Kassambra, 2023) were conducted with Games-Howell tests to control for unequal sample sizes between the clusters (Rusticus & Lovato, 2014).
2.6.2 Differences in general math ability, practice behaviour, and learning outcomes
To analyse differences in general math ability and practice behaviour between the clusters, three one-way ANOVAs (same R function and post-hoc as mentioned above) were performed, each with cluster as the independent variable and general math ability, number of unique problems, and accuracy as the dependent variables. Additional paired samples t-tests (.test function, R) were conducted per cluster to compare the accuracy and average chosen task difficulty.
To analyse the differences in learning outcomes between the shared control clusters, a GLM repeated measures ANOVA (ez package, ezANOVA function; Lawrence, 2016) was used with Time (pretest/posttest) as within-subject factor, and Cluster (1/2/3/4) as between-subject factor. A Type II sum of squares was used (Smith & Cribbie, 2021). Dunn’s test to control for unweighted group sizes with Benjamin-Hochberg correction for multiple comparisons (Félix & Menezes, 2018) was used as the post-hoc test (FSA package; Ogle et al., 2023). For all tests, a significance threshold of p < .05 was used. For post-hoc tests, significant and relevant non-significant results were reported. Five participants were excluded from the analysis since they had missing values on either the pretest (n=1) or posttest (n=4). These were learners of the few-to-hard cluster (n=1), the some-to-easy cluster (n=1), and the many-to-all cluster (n=3)To analyse the differences in learning outcomes between the shared control clusters, a GLM repeated measures ANOVA (ez package, ezANOVA function; Lawrence, 2016) was used with Time (pretest/posttest) as within-subject factor, and Cluster (1/2/3/4) as between-subject factor. A Type II sum of squares was used (Smith & Cribbie, 2021). Dunn’s test to control for unweighted group sizes with Benjamin-Hochberg correction for multiple comparisons (Félix & Menezes, 2018) was used as the post-hoc test (FSA package; Ogle et al., 2023). For all tests, a significance threshold of p < .05 was used. For post-hoc tests, significant and relevant non-significant results were reported. Five participants were excluded from the analysis since they had missing values on either the pretest (n=1) or posttest (n=4). These were learners of the few-to-hard cluster (n=1), the some-to-easy cluster (n=1), and the many-to-all cluster (n=3).
The first research question examined differences in how learners used shared control by clustering the quantity and direction of changes in task difficulty. Table 2 shows the means and standard deviations of the quantity and direction of changes per cluster. The No-changes cluster (C1) included 17 learners. The Few-to-hard cluster (C2) included 13 learners who, on average, made few (below two) changes, primarily to the hard difficulty. The Some-to-easy cluster (C3) included 30 learners who made some (a bit under 3) changes, most of the time to the easy difficulty. The Many-to-all cluster (C4) included 38 learners who made relatively many (between 4 and 5) changes in task difficulty. Those changes were almost equally spread over the three task difficulties.
Table 2
Cluster Statistics Shared Control
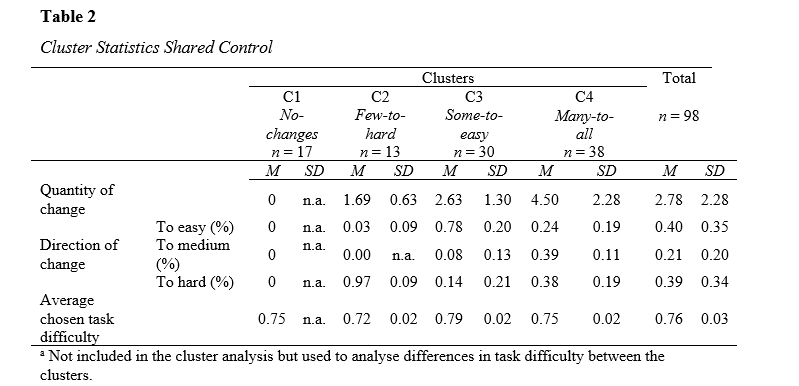
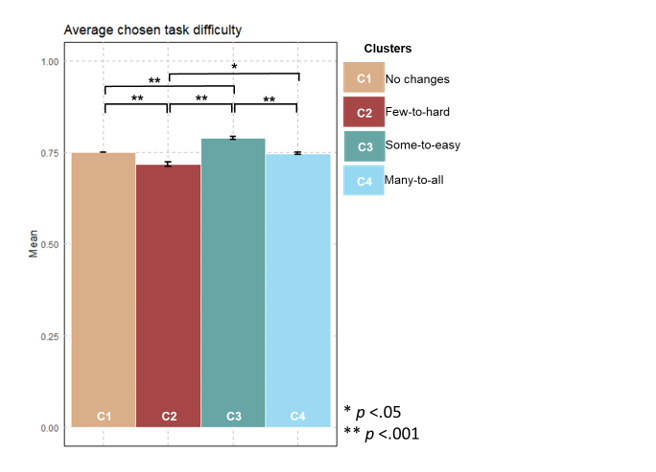
The one-way ANOVA showed differences in the average chosen task difficulty between the four clusters, F(3) = 51.59, p <.001, η²p = .622. Post hoc tests indicated that the chosen task difficulty was highest for the Few-to-hard cluster (reflecting a lower probability level; C2) compared to the other three clusters and that it was lowest (reflecting a higher probability level) in the Some-to-easy cluster (C3). The chosen task difficulty of the Many-to-all cluster (C4) and no changes cluster (C1) did not differ (Figure 3).
Figure 3
Mean, SE, and post-hoc results for Average chosen task difficulty per cluster
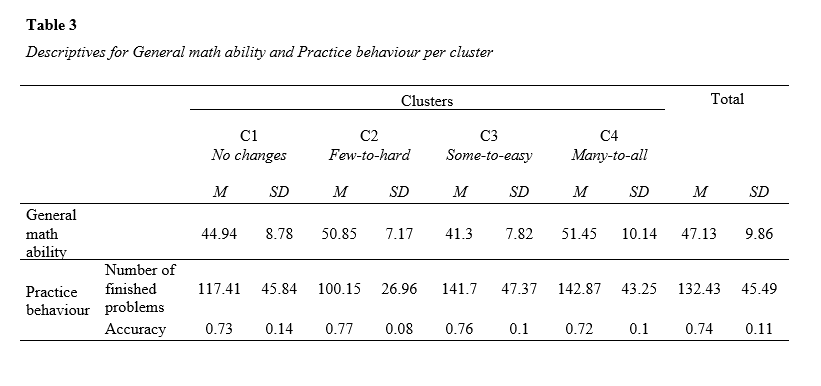
Research question 2 aimed to determine the relationship between the clusters, general math ability, and practice behaviour. Table 3 summarises the descriptives per cluster.
Table 3
Descriptives for General math ability and Practice behaviour per cluster
Regarding general math ability, the one-way ANOVA showed a difference between the clusters, F(3) = 8.39, p > .001, η²p = .211. Post hoc tests indicated that learners in the Some-to-easy cluster (C3) have a lower general math ability than learners in the Few-to-hard cluster (2; p = .003) or learners in the Many-to-all cluster (C4; p < .001; Figure 4A).
Regarding the number of unique tasks, the one-way ANOVA showed a difference between the clusters, F(3) = 4.27, p = .007, η²p = .120. Post hoc tests indicated that learners in the Few-to-hard cluster (C2) finished fewer unique tasks than learners in the Some-to-easy cluster (C3; p = .004) and learners in the Many-to-all cluster (C4; p = .001; Figure 4B).
Regarding accuracy, the one-way ANOVA showed no significant differences between the clusters, F(3) = 1.17, p = .327, η²p = .036. Learners across all clusters solved a comparable percentage of problems correctly (Figure 4C). Comparing accuracy with the average chosen task difficulty, the paired-samples t-tests showed that accuracy did not differ from the average chosen task difficulty for the No changes cluster (C1; p = .597), the Few-to-hard cluster (C2; p = .058), and the Many-to-all cluster (C4; p = .069). For learners in the Some-to-easy cluster (C3), the accuracy was lower than the average chosen task difficulty (C3; p = .038).
Figure 4
Mean, SE, and post-hoc results for (A) General math ability, (B) Number of unique problems, and (C) Accuracy per cluster
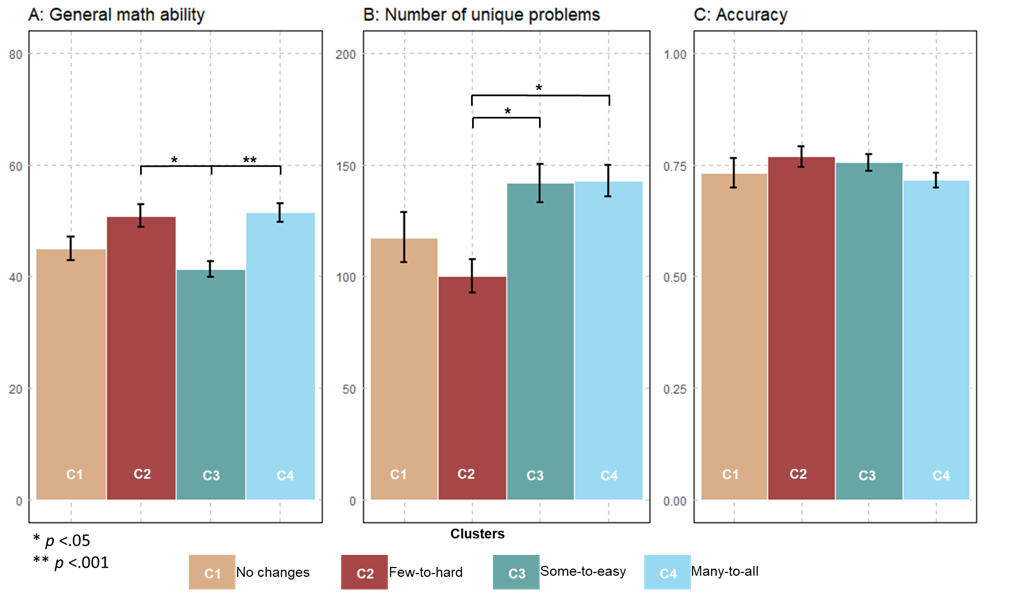
Table 4
Descriptives on Learning Outcomes per Cluster
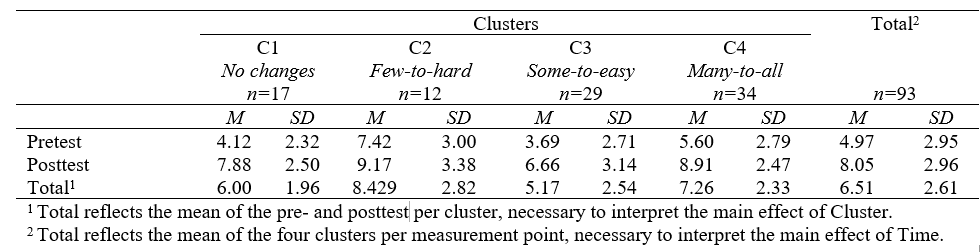
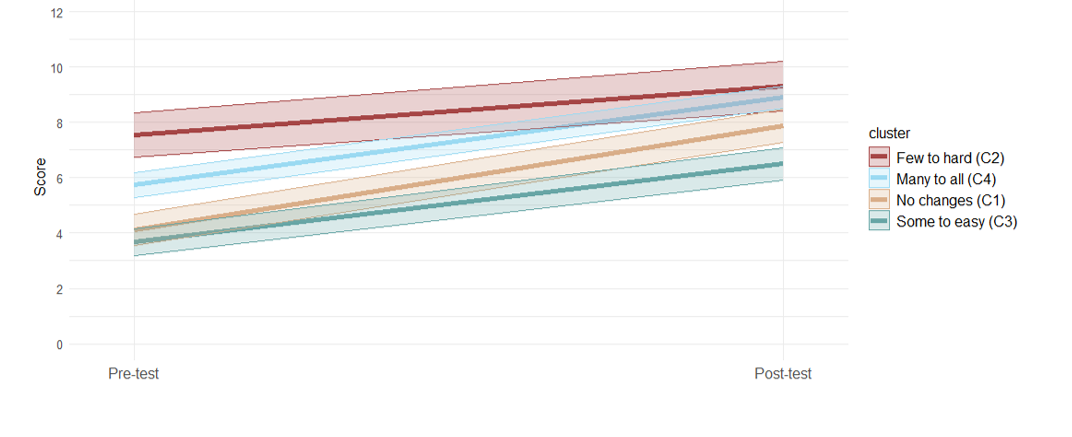
The second research question also aimed to determine differences in learning outcomes between the clusters, see Table 4. The GLM Repeated measures ANOVA showed a main effect of Cluster, F(3, 89) = 6.57, p > .001, η²p = .164, and of Time, F(1, 89) = 117.68, p > .001, η²p = .245. No significant interaction effect was found between Cluster and Time, F(3, 89) = 1.39, p = .250, η²p = .011.
Post-hoc analyses on Cluster revealed differences between the clusters on mean scores on the pre- and posttest, see Figure 4 and Table 4. Learners in the Few-to-hard cluster (C2) on average scored higher on the pre- and posttest than the learners in the Some-to-easy cluster (C3; p > .001), and learners in the No changes cluster (C1; p = .02). Learners in the Some-to-easy cluster (C3) on average also scored lower on the pre- and on the posttest than learners in the Many-to-all cluster (C4; p > .001). Regarding time, learners scored higher on the posttest than on the pretest, indicating learning gain. As there was no interaction between Cluster and Time, learning gain of the four clusters is considered comparable (Figure 5).
Figure 5
Interaction plot, including SE
This study explored individual differences in upper primary school learners’ use of shared control in ALTs (RQ1) and the relation with general math ability, practice behaviour, and learning outcomes (RQ2). To do so, the quantity and directions of learners’ task difficulty changes in shared control were clustered, and differences between clusters regarding general math ability, practice behaviour, and learning outcomes were examined. Learners were supported to make control decisions with personalised visualisations.
The first research question aimed to cluster learners’ use of shared control, considering the quantity and directions of change in task difficulty. Through exploratory cluster analysis, four clusters were identified: learners making no changes (C1), learners making some changes preferring hard difficulty (C2) or easy difficulty (C3), and learners who frequently changed across all task difficulties (C4). Compared to previous research that primarily focused on learners’ directions of change (Jansen et al., 2016; Knoop-van Campen et al., 2024; Papoušek & Pelánek, 2017), this study found variations in both the quantity and direction of changes in task difficulty within shared control with personalised visualisations. This indicates variability in strategies for adjusting task difficulty among learners. While some learners consistently executed control, others went back and forth in task difficulties by making multiple adjustments. The fact that not all learners opted for easier task difficulties questions the general premise that learners avoid more challenging learning strategies (e.g., Carpenter et al., 2020).
Nevertheless, the cluster including learners mainly choosing easy difficulty, was relatively large, indicating that some learners prefer to make it easier for themselves. However, the results suggest that these learners may have selected easier problems as a deliberate and probably appropriate SRL strategy, aligning with their ability level. Their lower pretest scores confirm this alignment with their ability level. Together, the clusters endorse the complexity of individual differences in learners’ use of shared control (Janssen et al., 2016) by showing how learners execute different strategies for task selection. Based on these findings, it remains unclear to what extent the identified task selection strategies reflect deliberate and effective engagement in SRL. To better understand this relationship, we further examined how the clusters differ in terms of general math ability, practice behaviour, and learning outcomes.
The second research question aimed to determine the relation between the clusters and general math ability, practice behaviour, and learning. Regarding math ability, our results suggest that learners executed control in line with their needs. Learners who made no changes (C1) did not significantly differ in general math ability from any of the other clusters, suggesting this group mainly included learners who, in classroom terms, represent the ‘average’ math learners, practicing at medium difficulty. High-performing learners sought more challenge (Özdemir & Bostan, 2021) by choosing the hard difficulty (C2) or experimenting with the task difficulties (C4). Learners selecting easier difficulty (C3) tended to have lower general math abilities. As lower-performing learners generally need more successful experiences to boost their confidence (Kaskens et al., 2020b), these easier tasks may offer such opportunities, since learners are expected to have a higher chance (85% instead of 75%) of solving problems correctly when choosing the easier difficulty. While actual accuracy in C3 was lower than 85%, in the absence of a control group, we can only speculate whether accuracy would fall even further at higher difficulty levels for this cluster.
Regarding practice behaviour, learners who chose the hard difficulty (C2) completed fewer problems than learners who chose easier (C3) or made many changes (C4). Although the difference in average chosen task difficulty between clusters appears small, note that this reflects a difference in relative difficulty (Klinkenberg et al., 2011), since the very same problem may be easy for one learner but hard for another. The combination of both high average chosen task difficulty and high general math ability in cluster C2 entails that learners in this cluster likely faced more complex tasks than learners in C3 (low difficulty, low ability) or C4 (average difficulty, high ability). The problems encountered by learners in C2, therefore, likely involved more complex problem-solving and, consequently, greater time investment per finished problem, thus explaining the lower number of completed problems. This aligns with previous research indicating a negative association between task difficulty and the number of completed problems (Janssen, 2013).
RRegarding accuracy, in most clusters, learners reached accuracy levels that align with the average chosen difficulty level of tasks. Only learners choosing easier tasks (C3) were found to reach accuracy levels lower than expected based on the average chosen task difficulty. It remains unclear whether easier tasks lead to higher accuracy levels for learners in this cluster compared to tasks of medium difficulty in an ALT-controlled setting, and therefore, the successful experiences those learners need, as this study lacked a control condition. We propose two possible explanations for the discrepancy between the average chosen task difficulty and reached accuracy in this cluster.
First, it could be related to effort regulation (Baars et al., 2020; Bjork et al., 2013; Kostons et al., 2012; Van Gog & Paas, 2008). The expected interplay between chosen task difficulty and effort investment appears bidirectional, based on how learners perceive the relationship between effort and learning (Baars et al., 2020). Selecting a higher task difficulty tends to trigger greater effort investment. However, under shared control, learners who choose easier tasks may invest less effort, assuming that lower difficulty requires less effort.
While choosing easier tasks can be a valid regulation strategy, it only leads to successful outcomes if learners maintain sufficient effort. In the cluster where learners predominantly selected easy tasks (C3), reduced effort investment may have contributed to lower-than-expected accuracy levels. In contrast, learners in the other clusters are less likely to encounter issues with effort regulation, as they tend not to lower task difficulty and achieve accuracy levels in line with expectations. Therefore, when learners opt for easier tasks, they may benefit from support in regulating their effort to maintain performance and foster positive learning experiences (Kaskens et al., 2020b).
Second, it could be related to the matching of the subskills used in this study to learners’ prior knowledge. Mathematics comprises multiple subskills, some conditional for mastering subsequent ones (VanDerHeyden et al., 2019). Thus, inadequate mastery of a conditional subskill may hinder accuracy in subsequent ones. It might be the case that even the easiest problems on a topic are considered hard for some learners, especially those with lower general math ability present in the cluster where learners mainly chose easy difficulty (C3). In this case, it might be necessary for learners to work on subsequent subskills before progressing to the subskills used in this study. Since general math ability was not found to be low in the other clusters, prior knowledge is unlikely to be a limiting factor there. In terms of learning, learning gain was found in all clusters. However, the differences in task difficulty did not result in significant differences in learning outcomes across clusters. In previous research in an ALT controlled setting, lower task difficulty led to higher learning outcomes through more finished problems (Jansen et al., 2013). While we confirmed that easier problems led to more completed problems (Jansen et al., 2013), we did not find higher learning outcomes. This could be explained by the absence of differences in accuracy levels between the clusters; learners who chose harder task difficulty were able to successfully solve a relatively low number of more difficult tasks, compared to learners who chose easier task difficulty, who finished a relatively high number of easy tasks. Although learning gains did not differ between clusters, this does not imply that all learners benefit equally from shared control. The interplay between prior knowledge, task difficulty choices, and practice behaviour is complex and may affect learners differently depending on individual characteristics. To better understand these dynamics, it is essential to consider variation in these characteristics and to investigate more deeply the relationships among task difficulty, the number of finished problems, achieved accuracy, and learning.
This study has some limitations. First, the unequal cluster sizes and small effect sizes in learning outcomes suggest a potential power issue. However, this was partially addressed using Type II sum of squares and post-hoc tests (Félix & Menezes, 2018; Smith & Cribbie, 2021). Additionally, the absence of a control group using an ALT controlled setting limits the ability to investigate the benefits of shared control across clusters. This is especially relevant for understanding optimal task difficulty and how this may vary based on learner characteristics such as general math ability and practice behaviour.
Another limitation is the exclusion of data from the third math topic. Since this topic was introduced last, its influence on learners’ use of shared control during the first two topics is unlikely. Nevertheless, further validation of the clusters across other math topics, domains, and grades is necessary.
This study holds implications for educational design and practice by introducing a novel approach to understanding the use of shared control among learners. The learner types reflected in the clusters provide concrete insights and directions for future research. The clusters provide a way to account for individual differences among learners when investigating the effects of shared control to work towards personalised SRL support.
First, the discrepancy between the achieved accuracy and the chosen task difficulty for learners who choose easy tasks may suggest either a lower effort investment when learners choose easier tasks (Baars et al., 2020) or a mismatch between subskills and prior knowledge for this group of learners with relatively low math ability. Further investigation is needed to discern whether the low accuracy stems from reduced effort investment or a lack of understanding of the subject matter. Based on insights, teachers could support understanding of the subject matter or effort regulation if accuracy is lower than expected. If learners show inadequate mastery of a conditional subskill, this may hinder accuracy in subsequent ones. If this is the case, learners may require support beyond simplifying the specific subskill, such as the opportunity to practice the conditional subskill beforehand (Danhof et al., 2015). This option was not available in the current shared control design. Teachers can support effort investment by encouraging learners to reflect on their invested effort and relate it to accuracy levels using personalised visualisations. In future research, it might be of interest to actively ask learners to reflect on the invested effort after a set of completed tasks, to investigate the impact of choices in difficulty level on effort investment.
In some cases, it is unclear whether changes in difficulty level reflect conscious choices based on monitoring and, therefore, reflect SRL. For example, the learners who made no changes (C1) may have either overlooked shared control options due to cognitive overload of the task (Seufert, 2018) or perceived the system as adequately regulating task difficulty. While the latter group engages in SRL (Bjork et al., 2013), learners who overlook shared control options might benefit from a difficulty level selected by the ALT (Molenaar, 2022). This alternative can offer simpler tasks or eliminate the need to think about task selection, freeing cognitive resources for active monitoring and control, potentially aided by personalised visualisations, before transitioning to shared control (Molenaar, 2022).
Learners who prefer a specific difficulty level (C2 & C3) seem to make conscious choices, as their choices align with their general math ability. However, for both clusters, questions remain on whether shared control is the optimal form of SRL support (Molenaar, 2022). For example, for learners who prefer hard difficulty, it remains unclear whether the hard difficulty provides sufficient challenge or whether tasks could be even more challenging (Bjork & Bjork, 2014; Özdemir & Bostan, 2021). Moreover, in developing SRL, the question remains whether those learners need shared control or are ready to move towards full learner control (Author, 2022). A suggestion for future research to get more refined insight into learners’ choices in task difficulty selection is a temporal analysis of difficulty changes within clusters. Variability may exist when learners adjust task difficulty, particularly in those clusters favouring specific levels (C2 and C3). For instance, some learners may select harder tasks early in their practice, while others may do so later as their proficiency grows. How this relates to their monitoring, practice behaviour, and learning may differ.
Learners experimenting with shared control (C4) may have had sufficient cognitive capacity for successful SRL, given their relatively high math ability. However, considerable variability within this large cluster suggests this may not apply to all learners. Moreover, the presence of personalised visualisations combined with the opportunity to engage in shared control might have distracted some learners from the task, causing cognitive overload. Frequently changing task difficulty may reflect SRL behaviour or trial-and-error behaviour (Bjork et al., 2013). Distinguishing between the two involves examining whether learners actively monitor the consequences of their control actions to inform subsequent decisions (Kostons et al., 2010; 2012). If learners engage in SRL, they may better estimate their optimal task difficulty over time, potentially resulting in fewer changes in task difficulty (Bannert et al., 2014; Kinnebrew et al., 2014).
Future research should consider the presence of active monitoring to gain deeper insight into learners’ SRL behaviour within clusters. This is crucial for determining whether learners in each cluster can effectively use shared control or require initial modelling from technology (e.g., allowing the ALT to control the difficulty level). To achieve this, distinguishing between cognitive overload, adequate system regulation, engagement in SRL, and trial-and-error behaviour is essential. The current study does not provide direct means to differentiate between these possibilities, as capturing SRL behaviour during a learning task remains methodologically challenging.
Several research approaches could address this challenge. One option is think-aloud protocols, which capture learners’ thought processes in real time. While valuable, this method risks disrupting the authenticity of the learning setting, as learners may alter their natural behaviour under observation (Hu & Gao, 2017). A less intrusive alternative is retrospective interviews using personalised visualisations of learners’ task-selection patterns. These interviews could prompt learners to reflect on their reasoning, strategies, and perceptions of task difficulty regulation, preserving ecological validity while offering deeper insights into SRL behaviour. Combined with the clustering found in this study, this approach could help determine which learners are ready for shared control and which may benefit from initial modelling by the system to further develop SRL skills (Molenaar, 2022). However, a key limitation of retrospective interviews is that they provide insights only after the learning process, making them unsuitable for real-time personalised SRL support (Townsend et al., 2019).
A third approach, which allows for real-time adaptation, involves analysing the development of learners’ ability scores over time as estimated by the ALT while learners are working with the ALT (Dijkstra et al., 2023). This development is reflected in learners’ ability curves. Clustering these ability curves and examining their relationship to SRL measures has already provided some insight into whether learners are engaged in SRL or relying on trial-and-error strategies (Dijkstra et al., 2023). Developing a reliable method to predict ability curve progression in real time shows promise for adapting SRL support based on learners’ needs (Dijkstra et al., 2023). However, to assess when learners benefit from the opportunity to engage in shared control and when they need additional support from the system in an ALT controlled setting (Molenaar, 2022), further understanding is needed on the relation between learners’ choices in difficulty changes with the use of the clusters found in the current study, the clusters of the development of learners’ ability scores (Dijkstra et al., 2023) and in-depth insight in learners’ SRL behaviour with the use of retrospective interviews.
This study showed considerable variation in the use of shared control across four learner types. The use of shared control is found to be related to general math ability and to influence learners’ regulation of practice behaviour. Although a comparison with an ALT controlled setting to test this hypothesis is absent, learners seem to choose task difficulty levels in line with their needs and benefit from these choices, resulting in learning growth. The differences in practice behaviour across the clusters indicate varying SRL support needs. First, when a discrepancy exists between chosen task difficulty and accuracy levels, dependent on the causes of this low accuracy, SRL support directed towards effort investment seems appropriate. In other cases, the task at hand might be too difficult for learners; in such cases, learners may need to practice a conditional topic first. If the opportunity to engage in shared control causes cognitive overload, moving back towards ALT control might be necessary. Further understanding of whether learners engage in SRL by consciously monitoring and controlling their learning during practice is required. This can aid the decision to provide shared control to a learner, especially when cognitive resources for active monitoring and control are available within a learner. We suggest different types of SRL support needs in shared control.
This project has received funding from the European Research Council (ERC) under the European Union’s Horizon 2020 research and innovation programme (Grant agreement no. 10.3030/948786). We thank Gynzy® and the participating schools, learners, and teachers for their valuable contributions. We also thank Rick Dijkstra for his technical support with the Learning Path App.
Alboukadel, K., & Mundt, F. (2020). factoextra: Extract
and visualise the results of multivariate data analyses (1.0.7)
.
https://cran.r-project.org/package=factoextra
Aleven, V., McLaughlin, E. A., Glenn, R. A., & Koedinger, K.
R. (2016). Instruction based on adaptive learning technologies. In
R. E. Mayer & P. Alexander (Eds.), Handbook of Research
on Learning and Instruction (pp. 522–560). Routledge.
Baars, M., Wijnia, L., de Bruin, A., & Paas, F. (2020). The
relation between students’ effort and monitoring judgments during
learning: A meta-analysis. Educational Psychology Review, 32,
979-1002.
https://doi.org/10.1007/s10648-020-09569-3
Bannert, M., Reimann, P., & Sonnenberg, C. (2014). Process
mining techniques for analysing patterns and strategies in
students’ self-regulated learning. Metacognition and
learning, 9, 161-185.
https://doi.org/10.1007/s11409-013-9107-6
Bjork, E. L., & Bjork, R. A. (2014). Making things hard on
yourself, but in a good way: Creating desirable difficulties to
enhance learning. In M. A. Gernsbacher & J. Pomerantz (Eds.),
Psychology and the Real World: Essays Illustrating
Fundamental Contributions to Society (pp. 59–64). Worth
Publishing.
Bjork, R. A. (1994). Memory and metamemory considerations in the
training of human beings. In J. Metcalfe & A. Shimamura
(Eds.), Metacognition: Knowing about Knowing (pp.
185–205). MIT Press.
https://doi.org/10.7551/mitpress/4561.003.0011
Bjork, R. A., Dunlosky, J., & Kornell, N. (2013).
Self-regulated learning: Beliefs, techniques, and illusions.
Annual Review of Psychology, 64 , 417–444.
https://doi.org/10.1146/annurev-psych-113011-143823
Brinkhuis, M., & Maris, G. (2019). Tracking ability: Defining
trackers for measuring educational progress. In Theoretical
and Practical Advances in computer-based Educational
Measurement. Springer Open.
https://doi.org/10.1007/978-3-030-18480-3_8
Brod, G., Kucirkova, N., Shepherd, J., Jolles, D., & Molenaar,
I. (2023). Agency in educational technology: Interdisciplinary
perspectives and implications for learning design. Educational
Psychology Review, 1–23.
https://doi.org/10.1007/s10648-023-09749-x
Carpenter, S. K., Endres, T., & Hui, L. (2020). Students’ use
of retrieval in self-regulated learning : Implications for
monitoring and regulating effortful learning experiences.
Educational Psychology Review, 32 , 1029–1054.
https://doi.org/10.1007/s10648-020-09562-w
Danhof, W., Bandstra, P., & Hofstetter, W. (2015).
Rekendrempels nemen. Volgens Bartjens, 34(3), 4-7.
Dignath, C., Buettner, G., & Langfeldt, H. P. (2008). How can
primary school students learn self-regulated learning strategies
most effectively? A meta-analysis on self-regulation training
programmes. Educational Research Review, 3 (2),
101–129.
https://doi.org/10.1016/j.edurev.2008.02.003
Dijkstra, S. H. E., Hinne, M., Segers, E., & Molenaar, I.
(2023). Clustering children’s learning behaviour to identify
self-regulated learning support needs. Computers in Human
Behavior, 145, 107754.
https://doi.org/10.1016/j.chb.2023.107754
Faber, J. M., Luyten, H., & Visscher, A. J. (2017). The
effects of a digital formative assessment tool on mathematics
achievement and student motivation: Results of a randomised
experiment. Computers and Education, 106 , 83–96.
https://doi.org/10.1016/j.compedu.2016.12.001
Félix, V. B., & Menezes, A. F. B. (2018). Comparisons of ten
corrections methods for t-test in multiple comparisons via Monte
Carlo study. Electronic Journal of Applied Statistical
Analysis, 11 (1), 74–91.
https://doi.org/10.1285/I20705948V11N1P74
Foster, N. L., Was, C. A., Dunlosky, J., & Isaacson, R. M.
(2017). Even after thirteen class exams, students are still
overconfident: The role of memory for past exam performance in
student predictions. Metacognition and Learning, 12 ,
1-19.
https://doi.org/10.1007/s11409-016-9158-6
Greene, J. A., & Azevedo, R. (2007). Adolescents’ use of
self-regulatory processes and their relation to qualitative mental
model shifts while using hypermedia. Journal of Educational
Computing Research, 36(2), 125–148.
https://doi.org/10.2190/G7M1-2734-3JRR-8033
Greene, J. A., & Azevedo, R. (2010). The measurement of
learners’ self-regulated cognitive and metacognitive processes
while using computer-based learning environments. Educational
Psychologist, 45, 203–209.
https://doi.org/10.1080/00461520.2010.515935
Hu, J., & Gao, X. A. (2017). Using think-aloud protocol in
self-regulated reading research. Educational Research Review,
22, 181-193.
https://doi.org/10.1016/j.edurev.2017.09.004
Jansen, B. R. J., Hofman, A. D., Savi, A., Visser, I., & van
der Maas, H. L. J. (2016). Self-adapting the success rate when
practicing math. Learning and Individual Differences, 51
, 1–10.
https://doi.org/10.1016/j.lindif.2016.08.027
Jansen, B. R. J., Louwerse, J., Straatemeier, M., Van der Ven, S.
H. G., Klinkenberg, S., & Van der Maas, H. L. J. (2013). The
influence of experiencing success in math on math anxiety,
perceived math competence, and math performance. Learning and
Individual Differences, 24, 190–197.
https://doi.org/10.1016/j.lindif.2012.12.014
Kaskens, J., Segers, E., Goei, S. L., van Luit, J. E., &
Verhoeven, L. (2020). Impact of Children's math self-concept, math
self-efficacy, math anxiety, and teacher competencies on math
development. Teaching and teacher education, 94 ,
103096. https://doi.org/10.1016/j.tate.2020.103096
Kassambra, A. (2023). rstatix: Pipe-friendly framework for
basic statistical tests (0.7.2) .
https://cran.r-project.org/package=rstatix
Karssen, M., Krepel, A., Stronkhorst, E., Lourens, J. M. P.,
Bruck, S., van Kessel, M., & Saab, N. (2023). Monitor
digitalisering funderend onderwijs: Onderzoeksrapport primair
onderwijs MYRA 2023. Kohnstamm Instituut.
Kinnebrew, J. S., Segedy, J. R., & Biswas, G. (2014).
Analysing the temporal evolution of students’ behaviors in
open-ended learning environments. Metacognition and learning,
9, 187-215.
https://doi.org/10.1007/s11409-014-9112-4
Klinkenberg, S., Straatemeier, M., & Van Der Maas, H. L. J.
(2011). Computer adaptive practice of maths ability using a new
item response model for on the fly ability and difficulty
estimation. Computers and Education, 57 (2),
1813–1824.
https://doi.org/10.1016/j.compedu.2011.02.003
Knoop‐van Campen, C. A. N., van der Graaf, J., Horvers, A., Kooi,
R., Dijkstra, R., & Molenaar, I. (2024). Enacting control with
student dashboards: The role of motivation. Journal of
Computer Assisted Learning, 1 -17.
https://doi.org/10.1111/jcal.12936
Kodinariya, T. M., & Makwana, P. R. (2013). Review on
determining of cluster in K-means clustering. International
Journal of Advance Research in Computer Science and Management
Studies, 1 (6), 90–95.
https://www.researchgate.net/publication/313554124
Kostons, D., van Gog, T., & Paas, F. (2010). Self-assessment
and task selection in learner-controlled instruction: Differences
between effective and ineffective learners. Computers and
Education, 54(4), 932–940.
https://doi.org/10.1016/j.compedu.2009.09.025
Kostons, D., Van Gog, T., & Paas, F. (2012). Training
self-assessment and task-selection skills: A cognitive approach to
improving self-regulated learning. Learning and instruction,
22(2), 121-132.
https://doi.org/10.1016/j.learninstruc.2011.08.004
Lawrence, M. A. (2016). ez: Easy analysis and visualisation
of factorial experiments (4.4-0) .
https://cran.r-project.org/package=ez
Locke, E. A., & Latham, G. P. (1990). A theory of goal
setting & task performance. Prentice-Hall, Inc.
Maechler, M., Rousseeuw, P., Struyf, A., Hubert, M., & Hornik,
K. (2022). cluster: Cluster analysis basics and extensions
(2.1.4).
https://cran.r-project.org/package=cluster
McGarth, M. C. (2011). Grade equivalents. In S. Goldstein & J.
A. Naglieri (Eds.), Encyclopedia of child behavior and
development. Springer.
https://doi.org/10.1007/978-0-387-79061-9_1271
Molenaar, I., Knoop-Van Campen, C. A. N., & Hasselman, F.
(2017). The effects of a learning analytics empowered technology
on students' arithmetic skill development. ACM International
Conference Proceeding Series, 614–615.
https://doi.org/10.1145/3027385.3029488
Molenaar, I., Horvers, A., and Dijkstra, R. (2019). Young
learners’ regulation of practice behavior in adaptive learning
technologies. Frontiers in Psychology, 10 , 2792.
doi: 10.3389/fpsyg.2019.02792
Molenaar, I., Horvers, A., Dijkstra, R., & Baker, R. S.
(2020). Personalised visualisations to promote young learners'
SRL: The Learning Path App. ACM International Conference
Proceeding Series, 330–339.
https://doi.org/10.1145/3375462.3375465
Molenaar, I. (2022). The concept of hybrid human-AI regulation:
Exemplifying how to support young learners' self-regulated
learning. Computers and Education: Artificial Intelligence,
3 , 100070. https://doi.org/10.1016/j.caeai.2022.100070
Morgan, G. B. (2015). Mixed mode latent class analysis: An
examination of fit index performance for classification.
Structural Equation Modeling, 22 (1), 76–86.
https://doi.org/10.1080/10705511.2014.935751
Nelson, T. O. (1990). Metamemory: A theoretical framework and new
findings. Psychology of Learning and Motivation - Advances in
Research and Theory, 26, 125–173.
https://doi.org/10.1016/S0079-7421(08)60053-5
Ogle, D. H., Doll, J. C., Powell Wheeler, A., & Dinno, A.
(2023). FSA: Simple fisheries stock assessment methods
(0.9.4).
https://cran.r-project.org/package=FSA
Özdemir, D., & Isiksal Bostan, M. (2021). A Design Based
Study: Characteristics of Differentiated Tasks for Mathematically
Gifted Students. European Journal of Science and Mathematics
Education, 9(3), 125-144.
https://doi.org/10.30935/scimath/10995
Panadero, E. (2017). A Review of Self-regulated Learning: Six
Models and Four Directions for Research. Frontiers in
Psychology, 8.
https://doi.org/10.3389/fpsyg.2017.00422
Papoušek, J., & Pelánek, R. (2017, July). Should we give
learners control over item difficulty?. In Adjunct
Publication of the 25th Conference on User Modeling, Adaptation
and Personalization (pp. 299-303).
https://doi.org/10.1145/3099023.3099080
Plass, J. L., & Pawar, S. (2020). Toward a taxonomy of
adaptivity for learning. Journal of Research on Technology in
Education, 52(3), 275–300.
https://doi.org/10.1080/15391523.2020.1719943
Rusticus, S. A., & Lovato, C. Y. (2014). Impact of sample size
and variability on the power and type I error rates of equivalence
tests: A simulation study. Practical Assessment, Research and
Evaluation, 19 (11), 1–10.
https://doi.org/10.7275/4s9m-4e81
Schunk, D. H. (1990). Goal Setting and Self-Efficacy During
Self-Regulated Learning. Educational Psychologist, 25(1),
71–86.
https://doi.org/10.1207/s15326985ep2501_6
Seufert, T. (2018). The interplay between self-regulation in
learning and cognitive load. Educational Research Review, 24,
116-129.
https://doi.org/10.1016/j.edurev.2018.03.004
Smith, C. E., & Cribbie, R. (2021). Factorial ANOVA with
unbalanced data: A fresh look at the types of sums of squares.
Journal of Data Science, 12 (3), 385–404.
https://doi.org/10.6339/jds.201407_12(3).0001
Team, R. C. (2023). R: A language and environment for
statistical computing (4.2.3). R Foundation for
Statistical Computing.
https://www.r-project.org/
Teasley, S. D. (2017). Student facing dashboards: One size fits
all? Technology, Knowledge and Learning, 22 (3),
377–384.
https://doi.org/10.1007/s10758-017-9314-3
Townsend, M., Shilts, M., Rios, K. D., Leavens, L., &
Panarella, K. (2019). NP13 Designing Retrospective Evaluation
Tools with Low-Literacy Adults: Development Process. Journal
of Nutrition Education and Behavior, 51 (7), S15-S16.
https://doi.org/10.1016/j.jneb.2019.05.337
Usher, E. L., & Schunk, D. H. (2018). Social cognitive
theoretical perspective of self-regulation. In D. H. Schunk &
J. A. Greene (Eds.), Handbook of self-regulation of learning
and performance (pp. 19–35). Routledge/Taylor & Francis
Group.
van Buuren, S., & Groothuis-Oudshoorn, K. (2011). mice:
Multivariate imputation by chained equations in R. Journal
of Statistical Software, 45 (3), 1–67.
https://doi.org/10.18637/jss.v045.i03
Van Der Heyden, A. M., Broussard, C., & Burns, M. K. (2021).
Classification agreement for gated screening in mathematics:
Subskill mastery measurement and classwide intervention.
Assessment for Effective Intervention, 46 (4), 270-280.
https://doi.org/10.1177/1534508419882484
Van Gog, T., & Paas, F. (2008). Instructional efficiency:
Revisiting the original construct in educational research.
Educational psychologist, 43(1), 16-26.
https://doi.org/10.1080/00461520701756248
Verbert, K., Govaerts, S., Duval, E., Parra, G., & Klerkx, J.
(2014). Learning dashboards : an overview and future research
opportunities. Pers Ubiquit Comput, 18 , 1499–1514.
https://doi.org/10.1007/s00779-013-0751-2
Vygotsky, L. S. (1978). Mind in society: The development of
higher psychological processes (Vol. 86). Harvard
university press.
Wilcox, J. (2023). Human Judgment: How Accurate Is It, and
How Can It Get Better? Springer Nature.
Winne, P. H. (2017). Learning analytics for self-regulated
learning. In C. Lang, G. Siemens, A. Wise, & D. Gasevic
(Eds.), Handbook of Learning Analytics (pp. 241–249).
https://doi.org/10.18608/hla17.021
Winne, P. H. (2018). Theorising and researching levels of
processing in self-regulated learning. British Journal of
Educational Psychology, 88 (1), 9–20.
https://doi.org/10.1111/bjep.12173
Winne, P. H., & Hadwin, A. F. (1998). Studying as
self-regulated learning. In D. J. Hacker, J. Dunlosky, & A.
Graesser (Eds.), Metacognition in Educational Theory and
Practice (pp. 277–304). Lawrence Erlbaum.
Ye, Z., Jiang, L., Li, Y., Wang, Z., Zhang, G., & Chen, H.
(2022). Analysis of Differences in Self-Regulated Learning
Behavior Patterns of Online Learners. Electronics, 11(23),
4013.
https://doi.org/10.3390/electronics11234013
Figure 6
Statistics to indicate the number of clusters (Within-cluster variation, Silhouette, and Gap statistic)
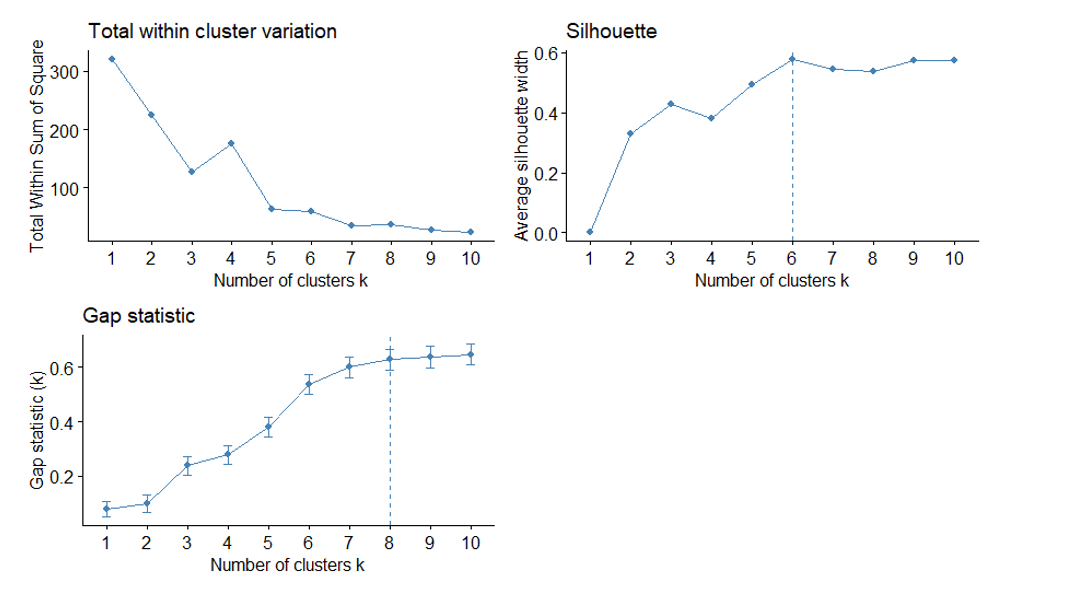
Elbow Method (Top-Left Graph):
This graph shows the total within-cluster sum of squares as a function of the number of clusters (𝑘). As 𝑘 increases, the total within-cluster variation decreases. The “elbow” in the total within-cluster variation graph appears around 𝑘=3. While the variation continues to decrease with more clusters, the rate of decrease slows noticeably after 𝑘=3, suggesting diminishing returns in reducing within-cluster variation beyond this point. A second elbow point is seen at 𝑘 =5.
Silhouette (Top-Right Graph):
The silhouette graph depicts the average silhouette width, which measures how well each data point fits within its own cluster relative to neighbouring clusters. Higher values indicate better-defined clusters. The average silhouette width reaches a relatively high value at 𝑘=3, suggesting that clusters are reasonably well-separated and cohesive. While 𝑘=6 gives the peak silhouette width, the improvement over 𝑘=3 is relatively modest, mainly when parsimony is considered.
Gap Statistic (Bottom Graph):
The gap statistic measures the difference between the total within-cluster variation for the observed data and the expected variation under a null reference distribution. Higher values indicate a more significant clustering structure compared to random data. The gap statistic increases steadily up to ( k=8 ), but the values at ( k=3 ), ( k=5 ), and ( k=6 ) are already relatively high and appear after a noticeable jump in the gap statistic value.
This appendix presents the cluster graphs and descriptive statistics for the variables included in the K-means clustering.
The Cluster graphs in Figure 7 compare clustering results for k=3 (left) and k=5 (right) using two principal components (Dim1 and Dim2) that explain a significant proportion of the data variance (46.1% and 39.5%, respectively). Dim1 represents the variation in specific difficulty levels. This explains 46.1% of the total variance in the data. Dim2 represents the variation in the number of changes in difficulty levels. This explains 39.5% of the total variance in the data.
Figure 7
Cluster graphs for the 3- and 5-cluster solution
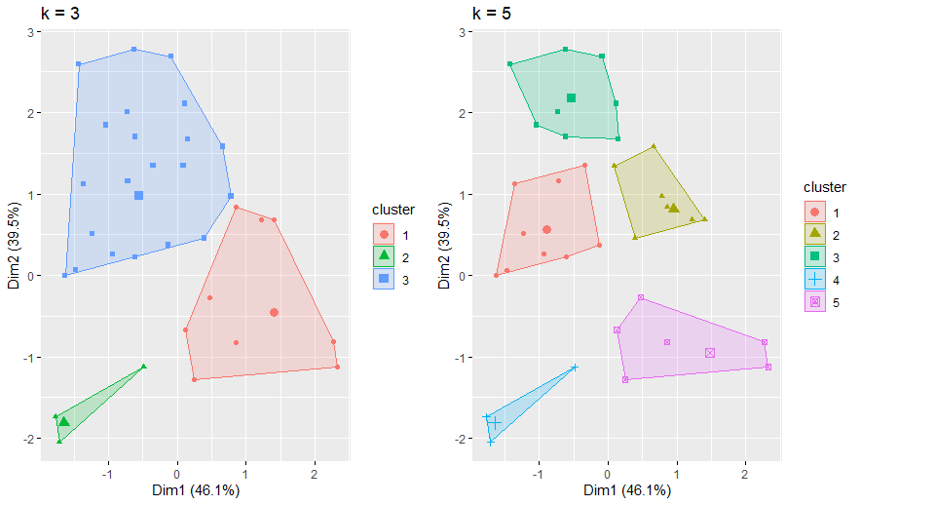
Table 5 shows the cluster statistics for the three- and five-cluster solutions. Below, we describe how the clusters in Figure 7 relate to the clusters in Table 5.
1. K=3 (Left Panel Figure 7):
o The data is grouped into three clusters:
Cluster 1 (red) relates to Table 5, cluster 2
Cluster 2 (green) relates to Table 5, cluster 1
Cluster 3 (blue) relates to Table 5, cluster 3
2. K=5 (Right Panel Figure 7):
o The data is split into five clusters:
Cluster 1 (red) relates to Table 5, cluster 3
Cluster 2 (yellow-green) relates to Table 5, cluster 4
Cluster 3 (light blue) relates to Table 5, cluster 5
Cluster 4 (blue) relates to Table 5, cluster 1
Cluster 5 (purple) relates to Table 5, cluster 2
3. Comparing K=5 to K=3, the clustering with K=5 is more granular, breaking larger clusters into smaller, more specific subgroups.
Table 5
Cluster statistics for the 3- and 5-cluster solution
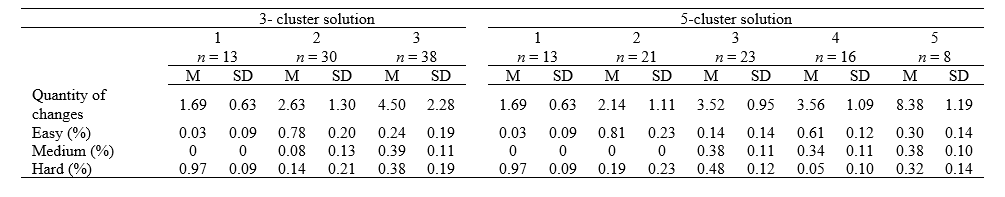
Table 6
Akaike’s information criterion and Bayesian inference criterion for the two possible cluster solutions